
Intended audience: ALL USERS
AO Easy Answers for Mobile: 2.0
Overview
This topic serves as a reference for all the visualizations available in the Easy Answers for Mobile App. The basic principle is that a visualization is shown that is compatible with the data available in the extracted data for a given question. For Chart visualizations, an icon 
Visualizations
Table w/Pagination
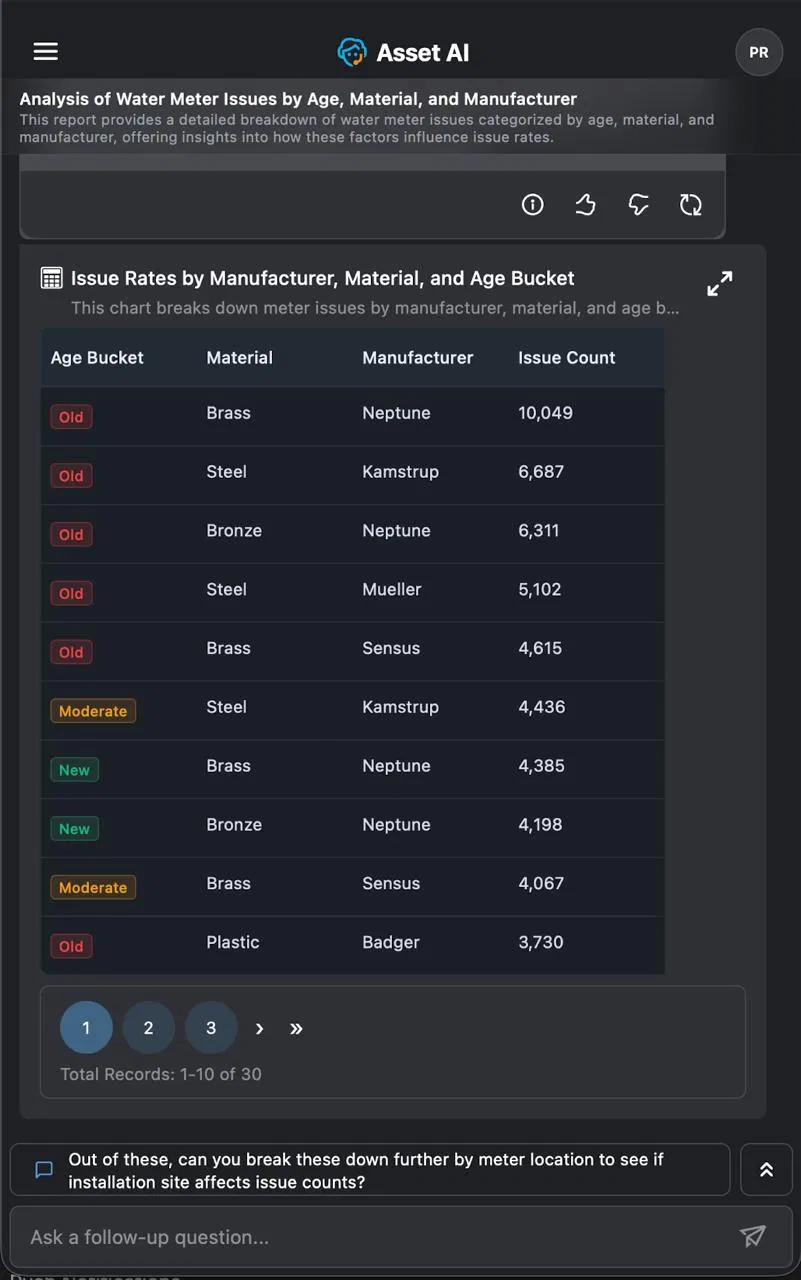
A table is displayed when the response involves multi-dimensional data with several attributes per record. Tables support pagination, showing the total record count and allowing navigation across pages. Categorical values such as age buckets are displayed as color-coded badges for easy scanning.
Example: Asking about issue rates broken down by manufacturer, material, and age bucket returns a paginated table with columns for Age Bucket, Material, Manufacturer, and Issue Count.
Data View
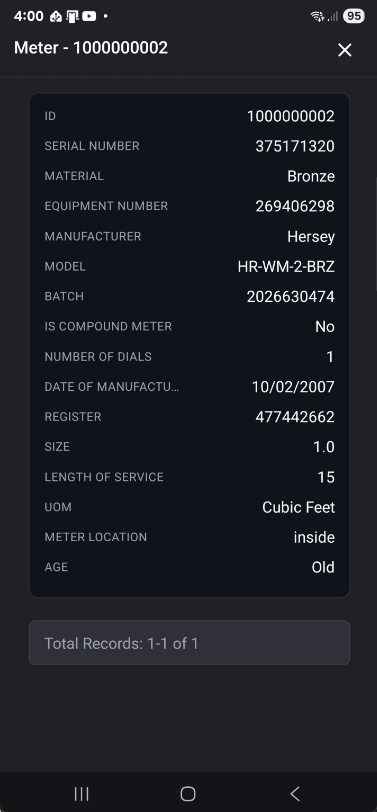
The Data View opens when a user selects a single record from a link in a Table. It presents that record as a labeled list of field values in a detail panel, with a record-count footer.
Example: Tapping a meter row opens a Data View for that meter, listing its serial number, manufacturer, material, model, and age as individual fields.
Data Requirements and Question Examples
|
Visualization |
Records |
Categorical Field |
Quantitative Field |
Temporal Field |
Question Examples |
|---|---|---|---|---|---|
|
Data View |
2 |
1 |
1 |
|
Show count of meter issues by material. Limit to 2 records |
|
3 to 5 |
1 |
1 |
|
Show count of meter issues by material. |
Charts
Pie / Semi Pie / Donut / Semi Donut
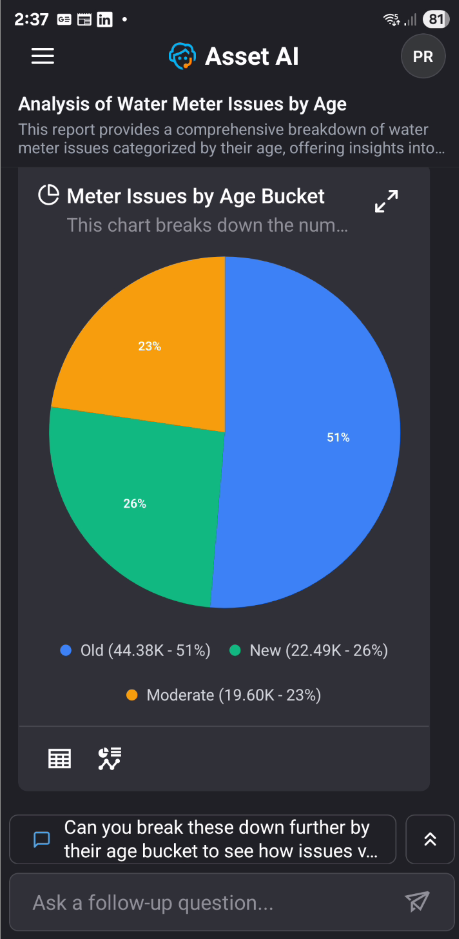
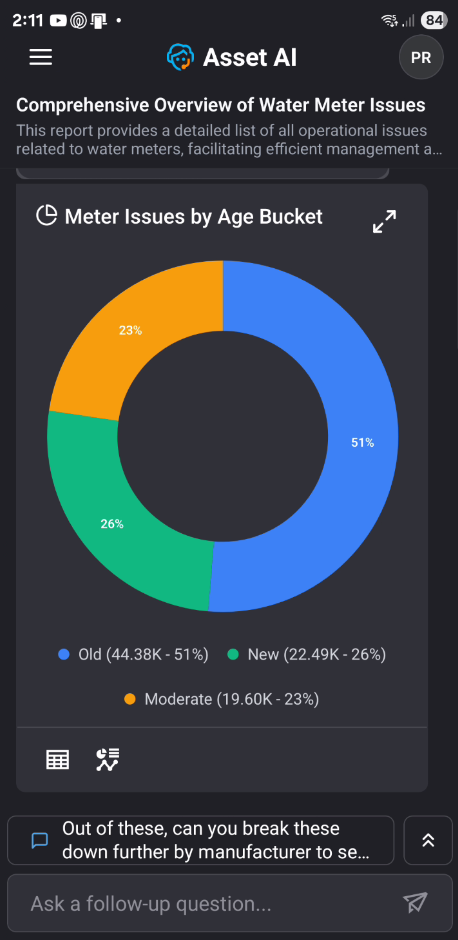
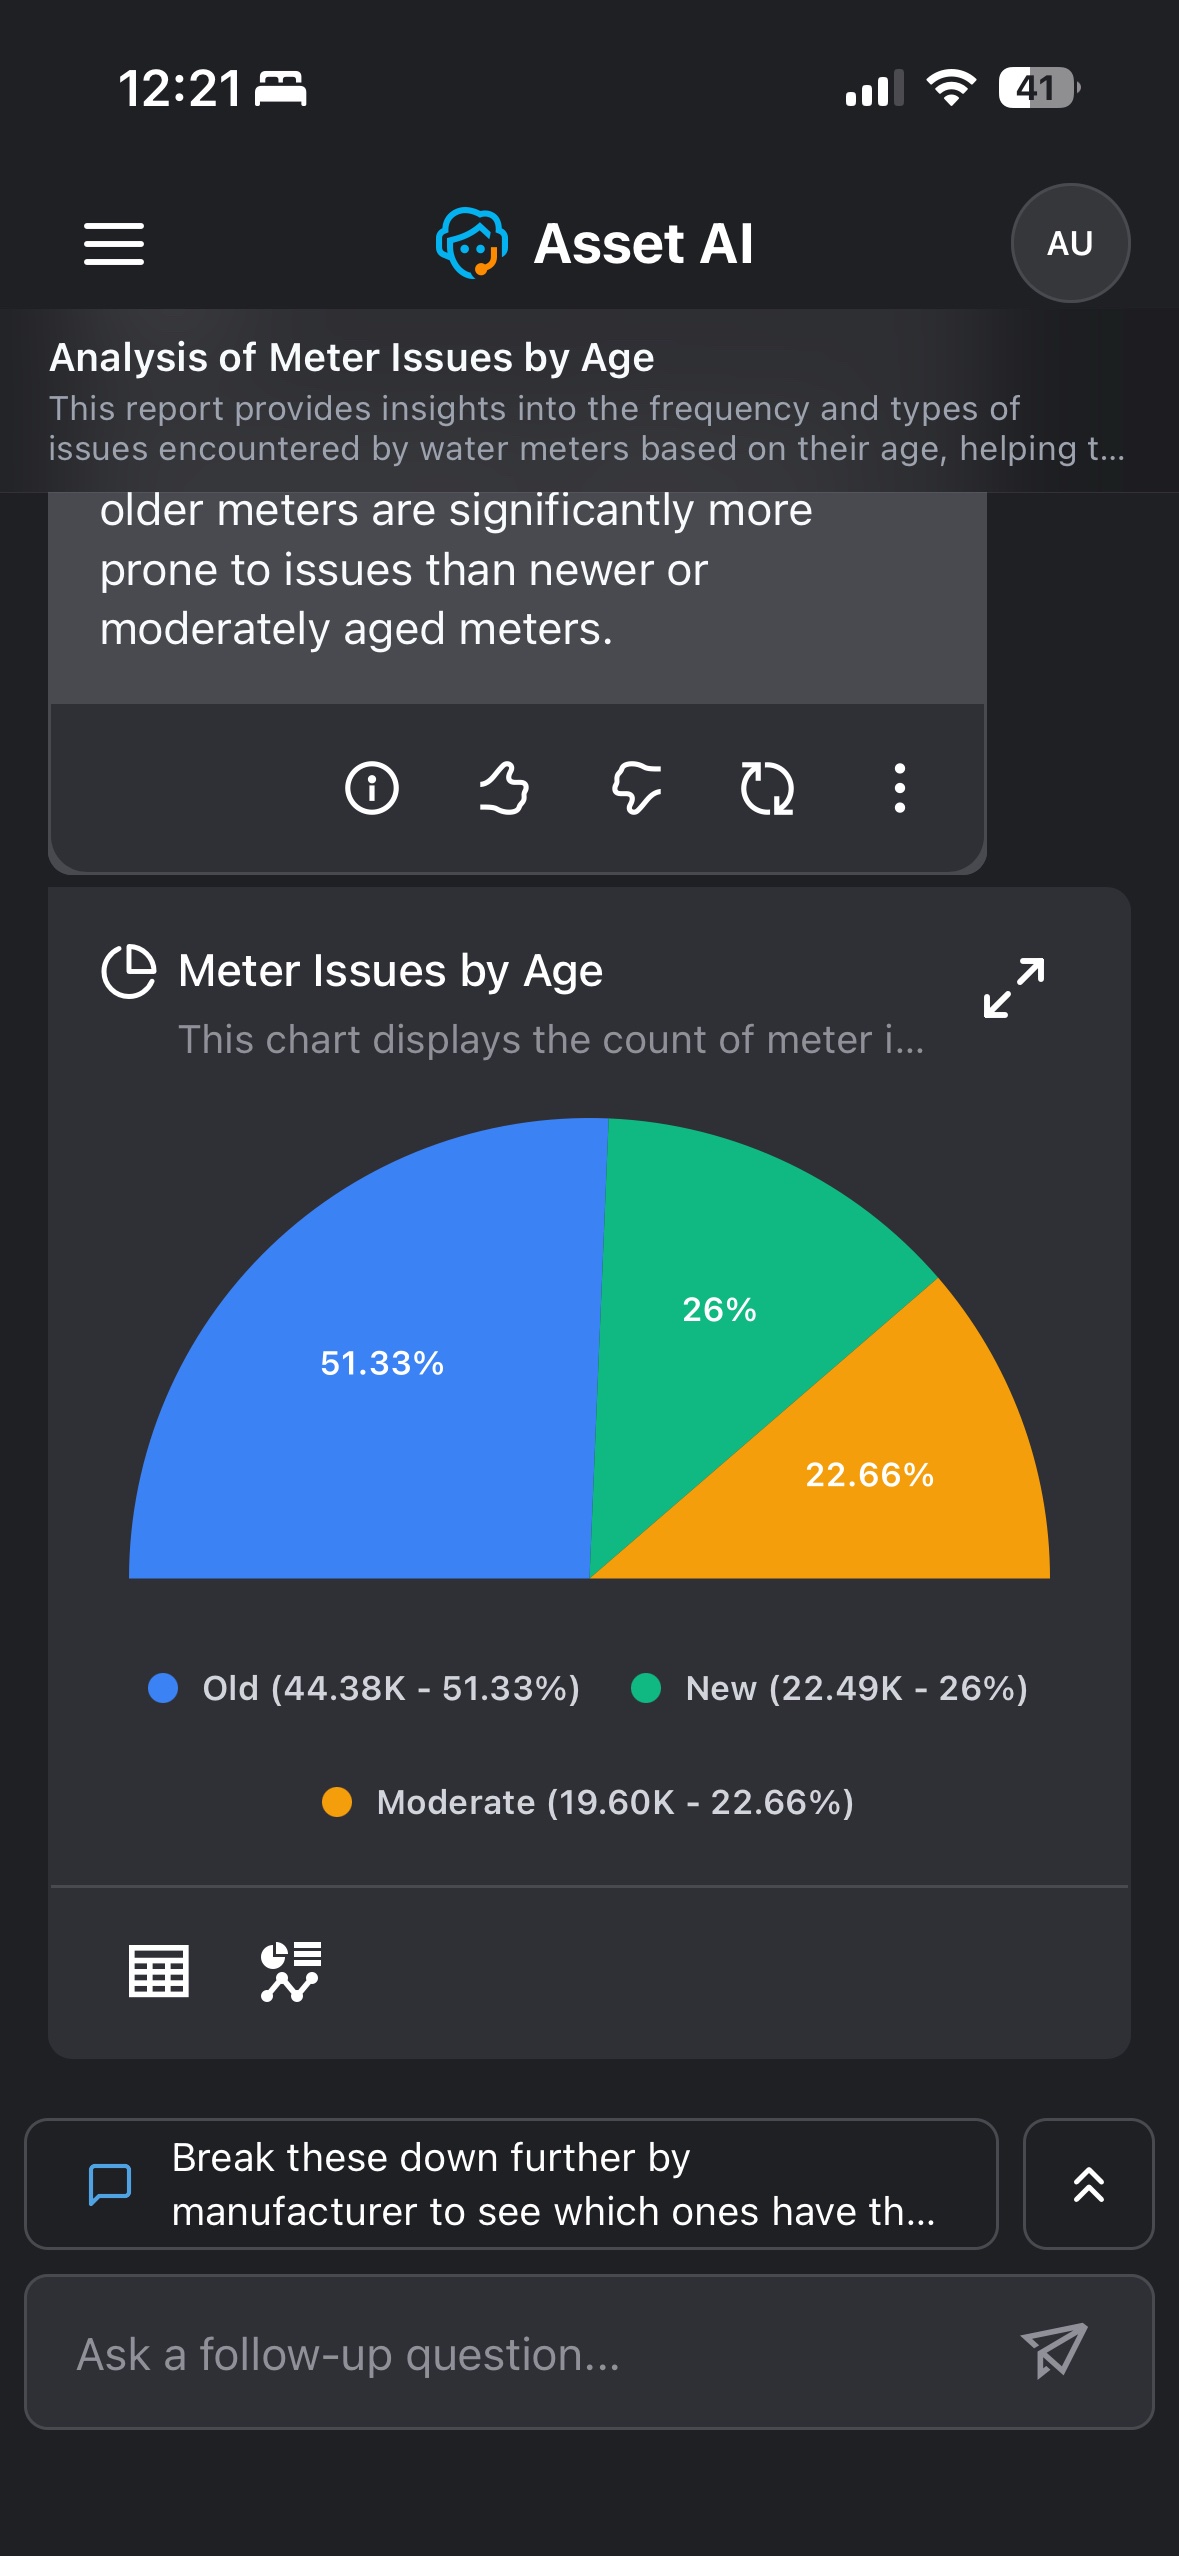
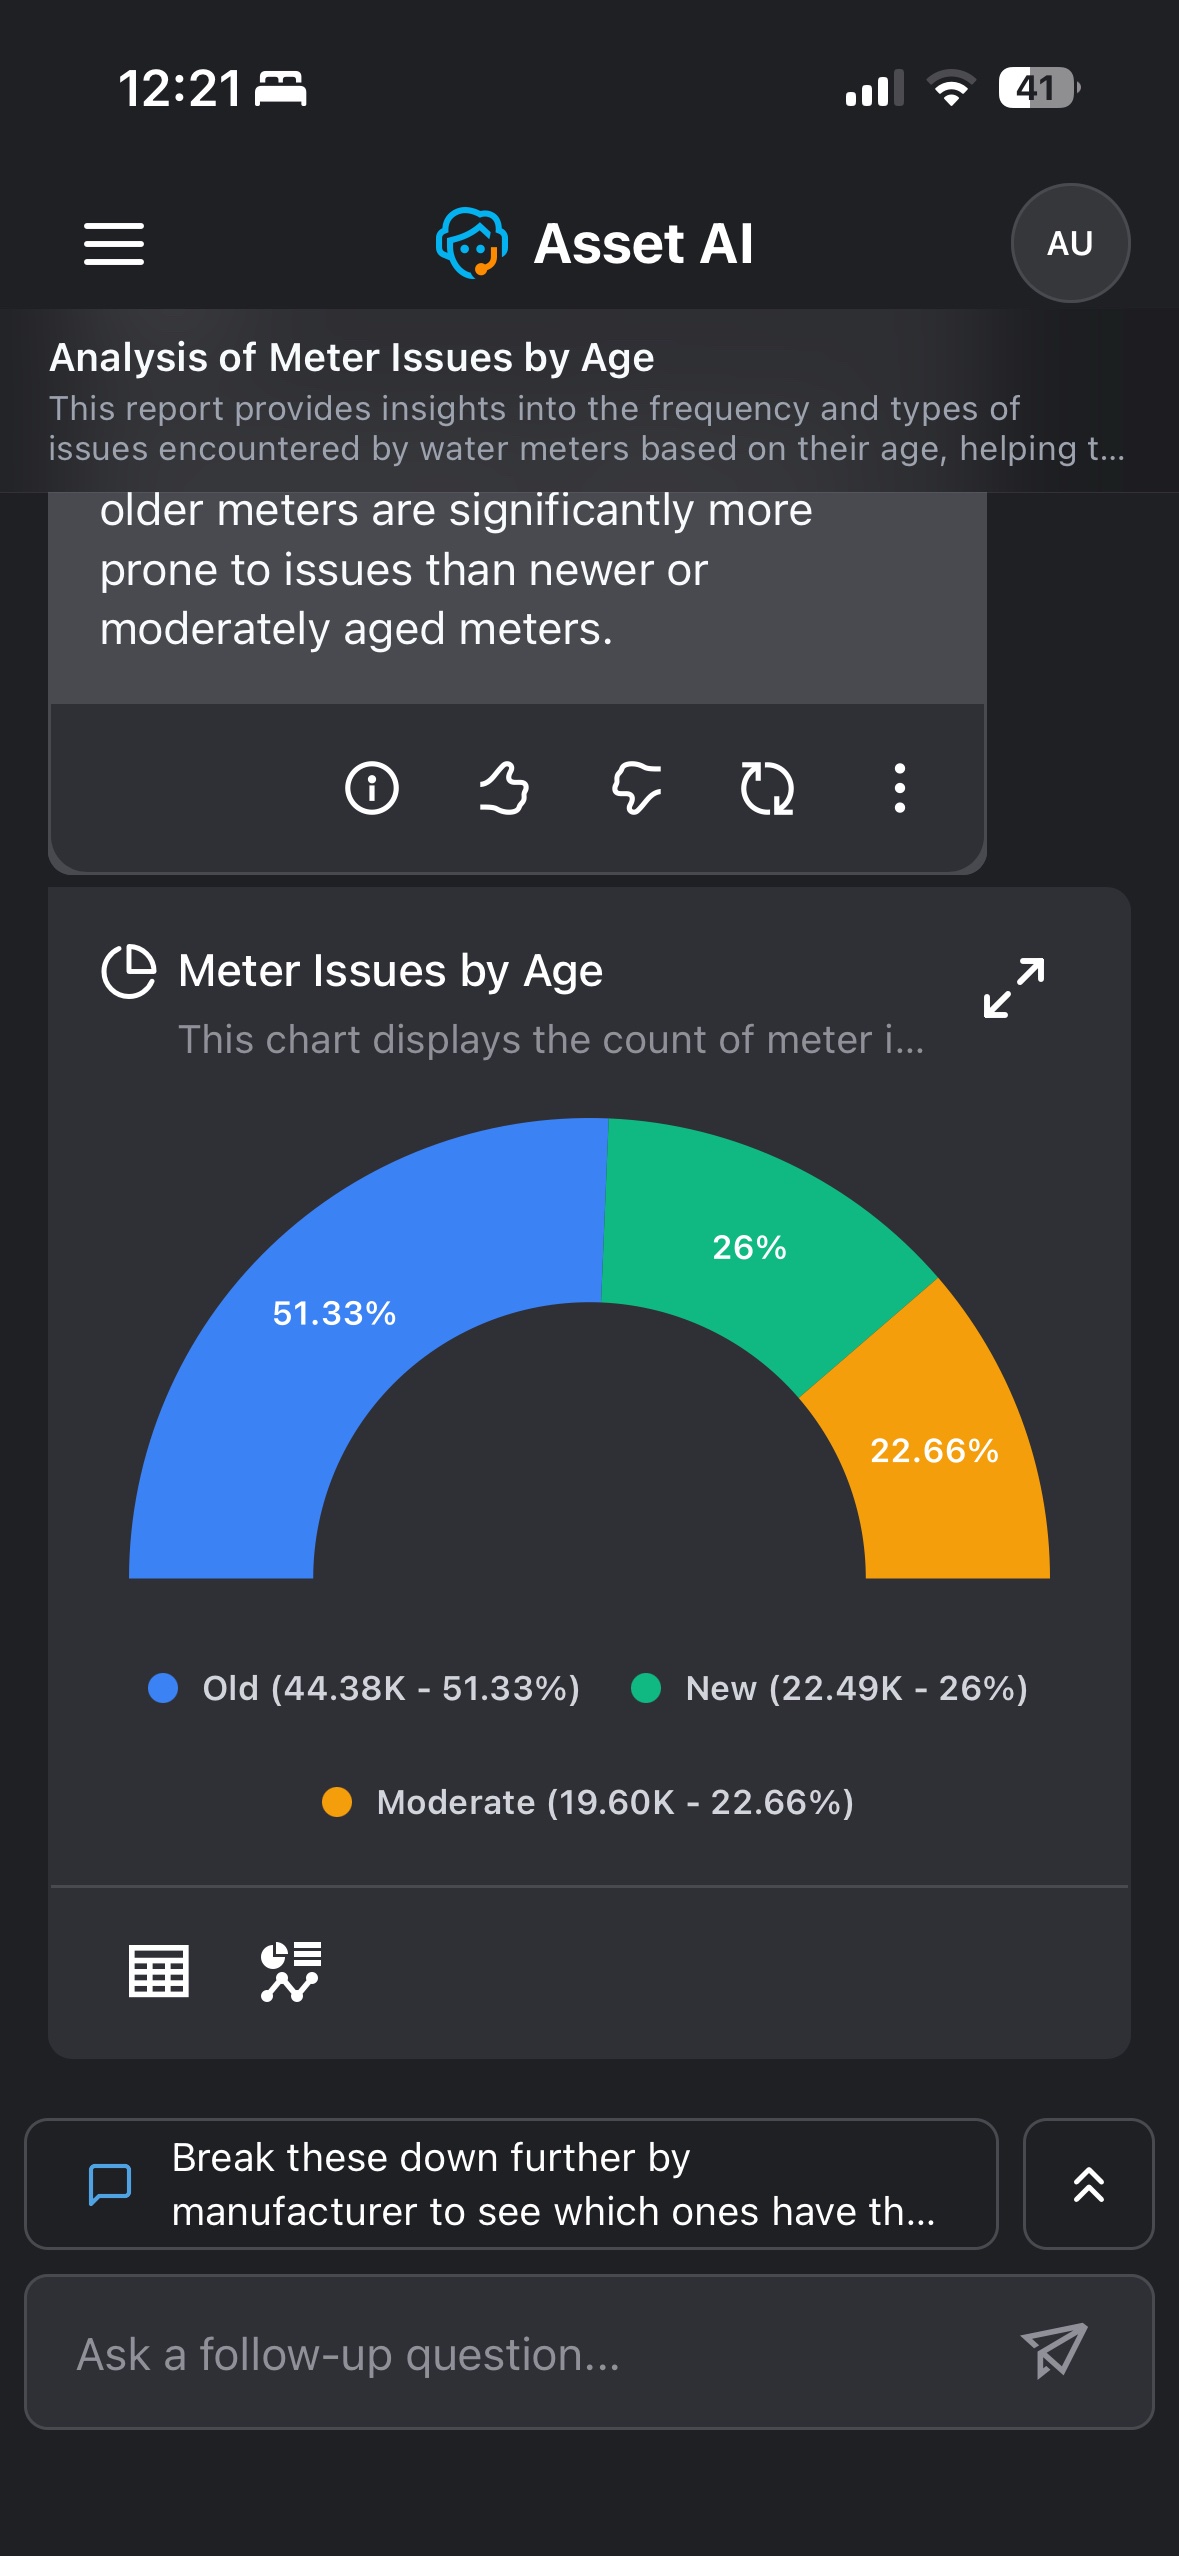
The Pie (or Donut) chart is displayed when the response involves proportional or percentage-based distribution across categories. The chart includes a legend below it showing each category with its count and percentage.
Example: Asking about meter distribution by age category returns a pie chart showing the percentage share of Old, New, and Moderate meters.
|
Pie |
Donut |
|---|---|
|
|
|
Semi Pie |
Semi Donut |
|
|
Data Requirements and Question Examples
|
Visualization |
Records |
Categorical Field |
Quantitative Field |
Temporal Field |
Question Examples |
|---|---|---|---|---|---|
|
Pie / Half-Pie / Donut / Half-Donut Charts |
2 |
1 |
1 |
|
Show count of meter issues by material. Limit to 2 records |
|
3 to 5 |
1 |
1 |
|
Show count of meter issues by material |
Column / Bar
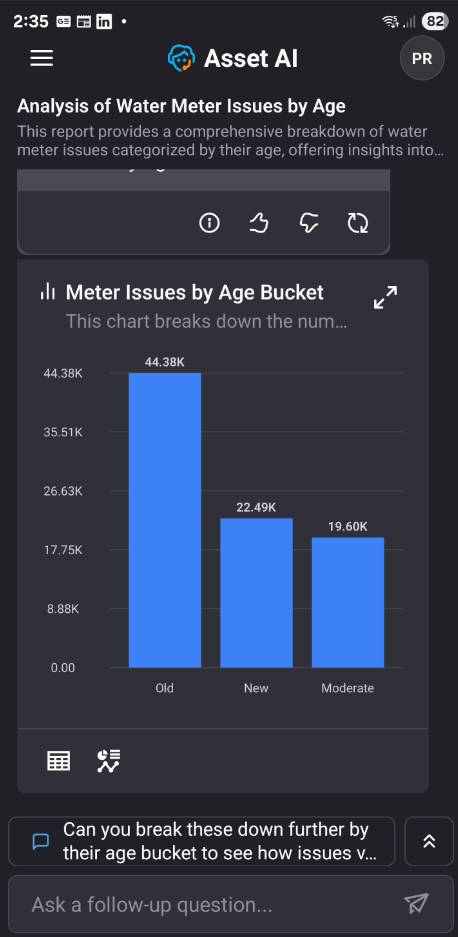
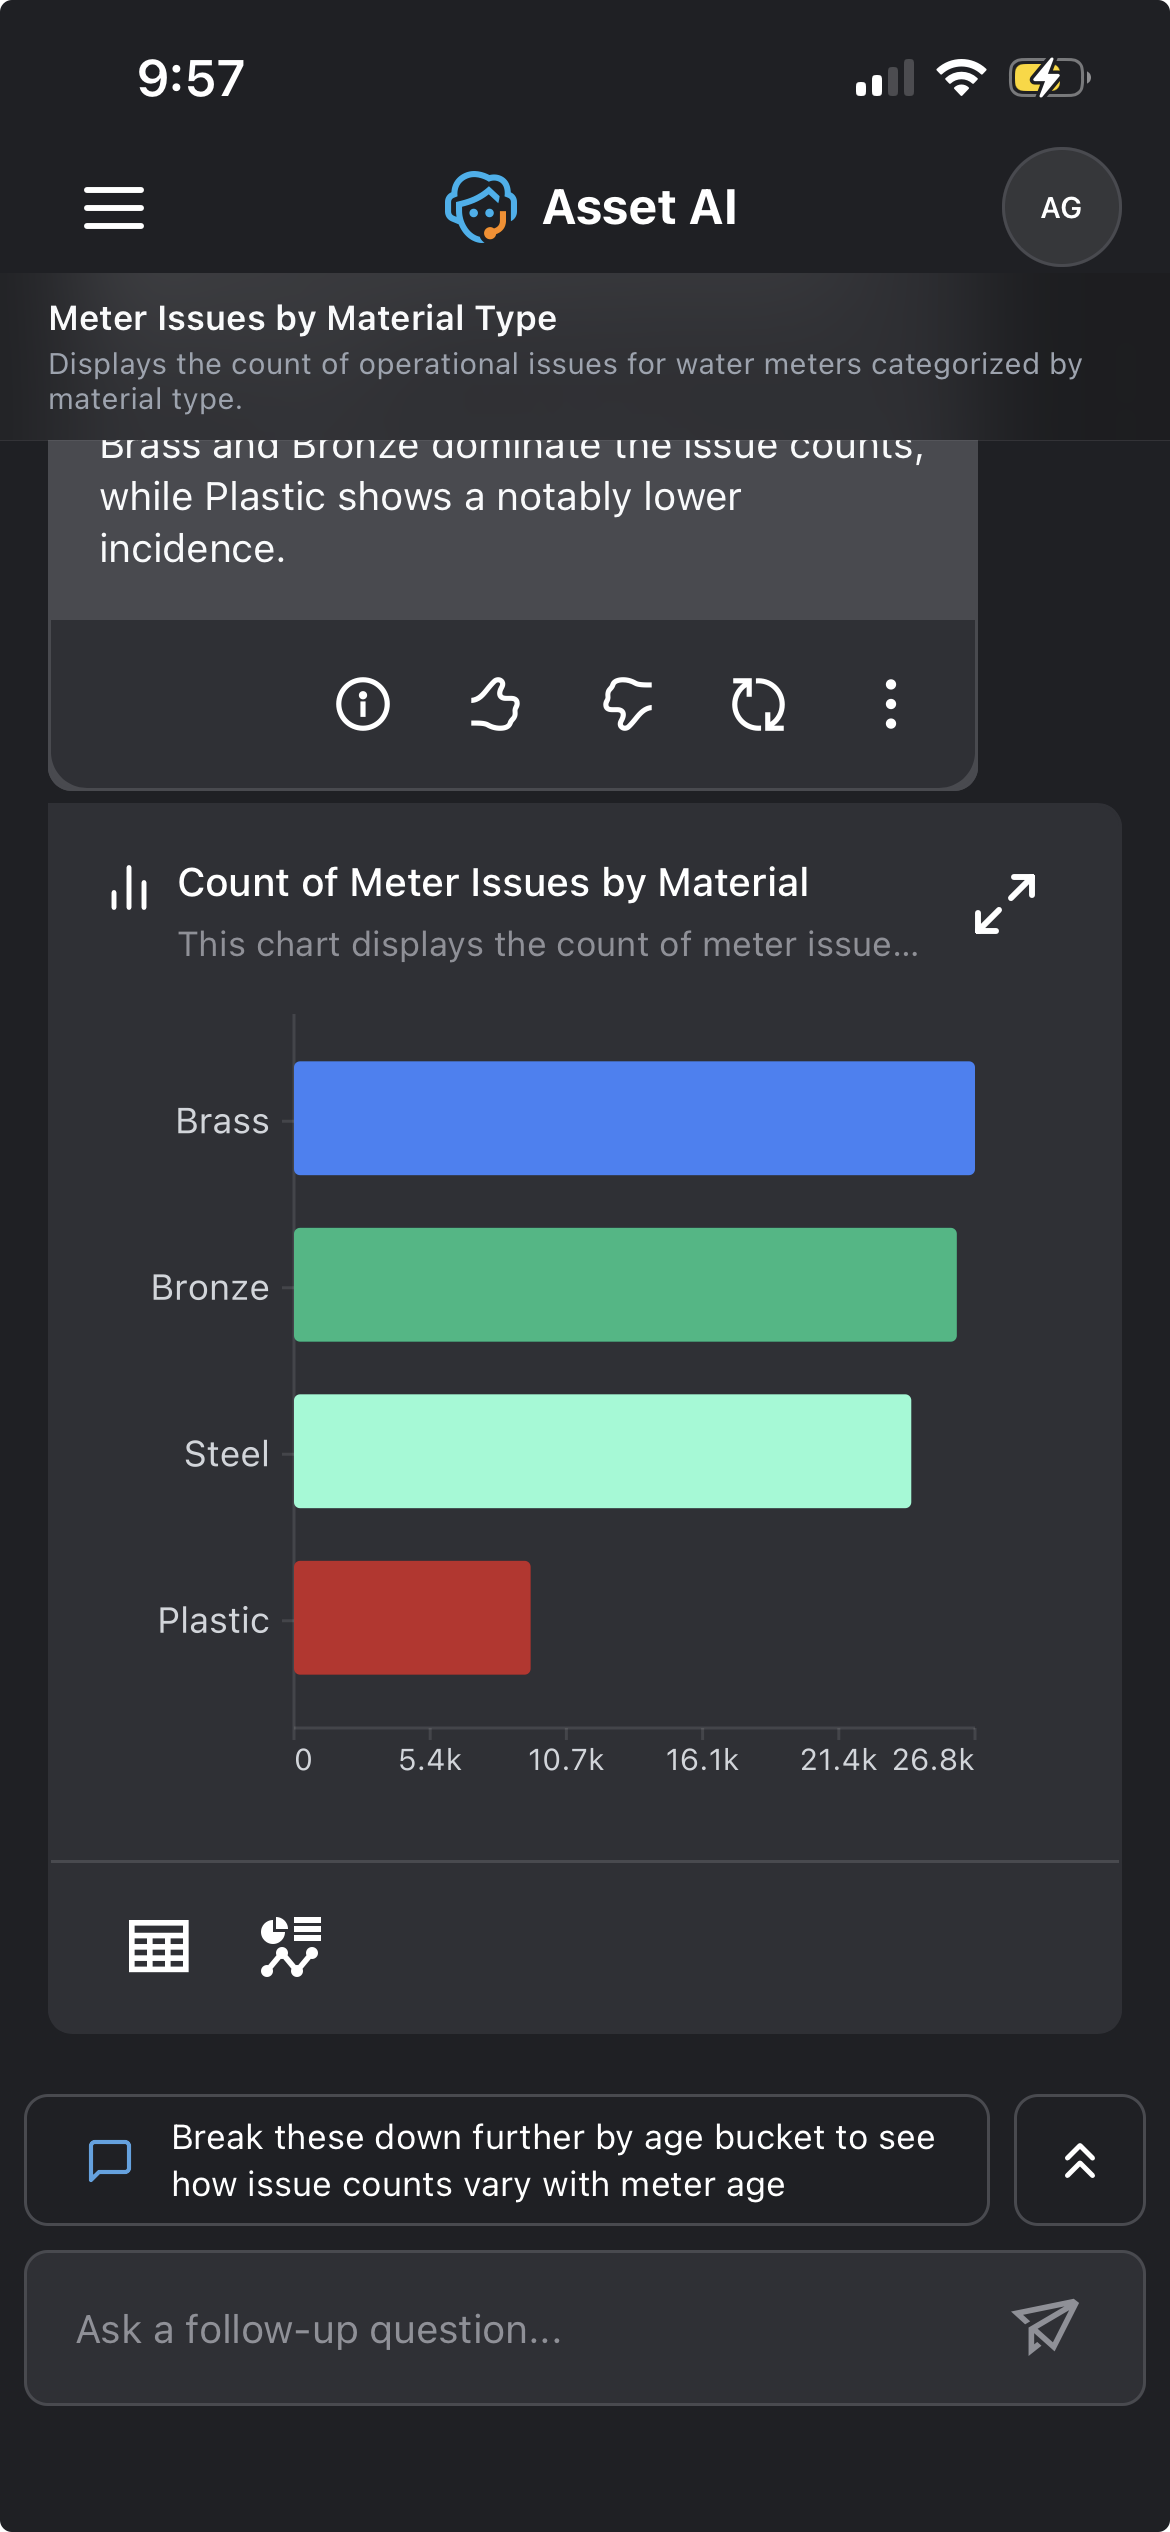
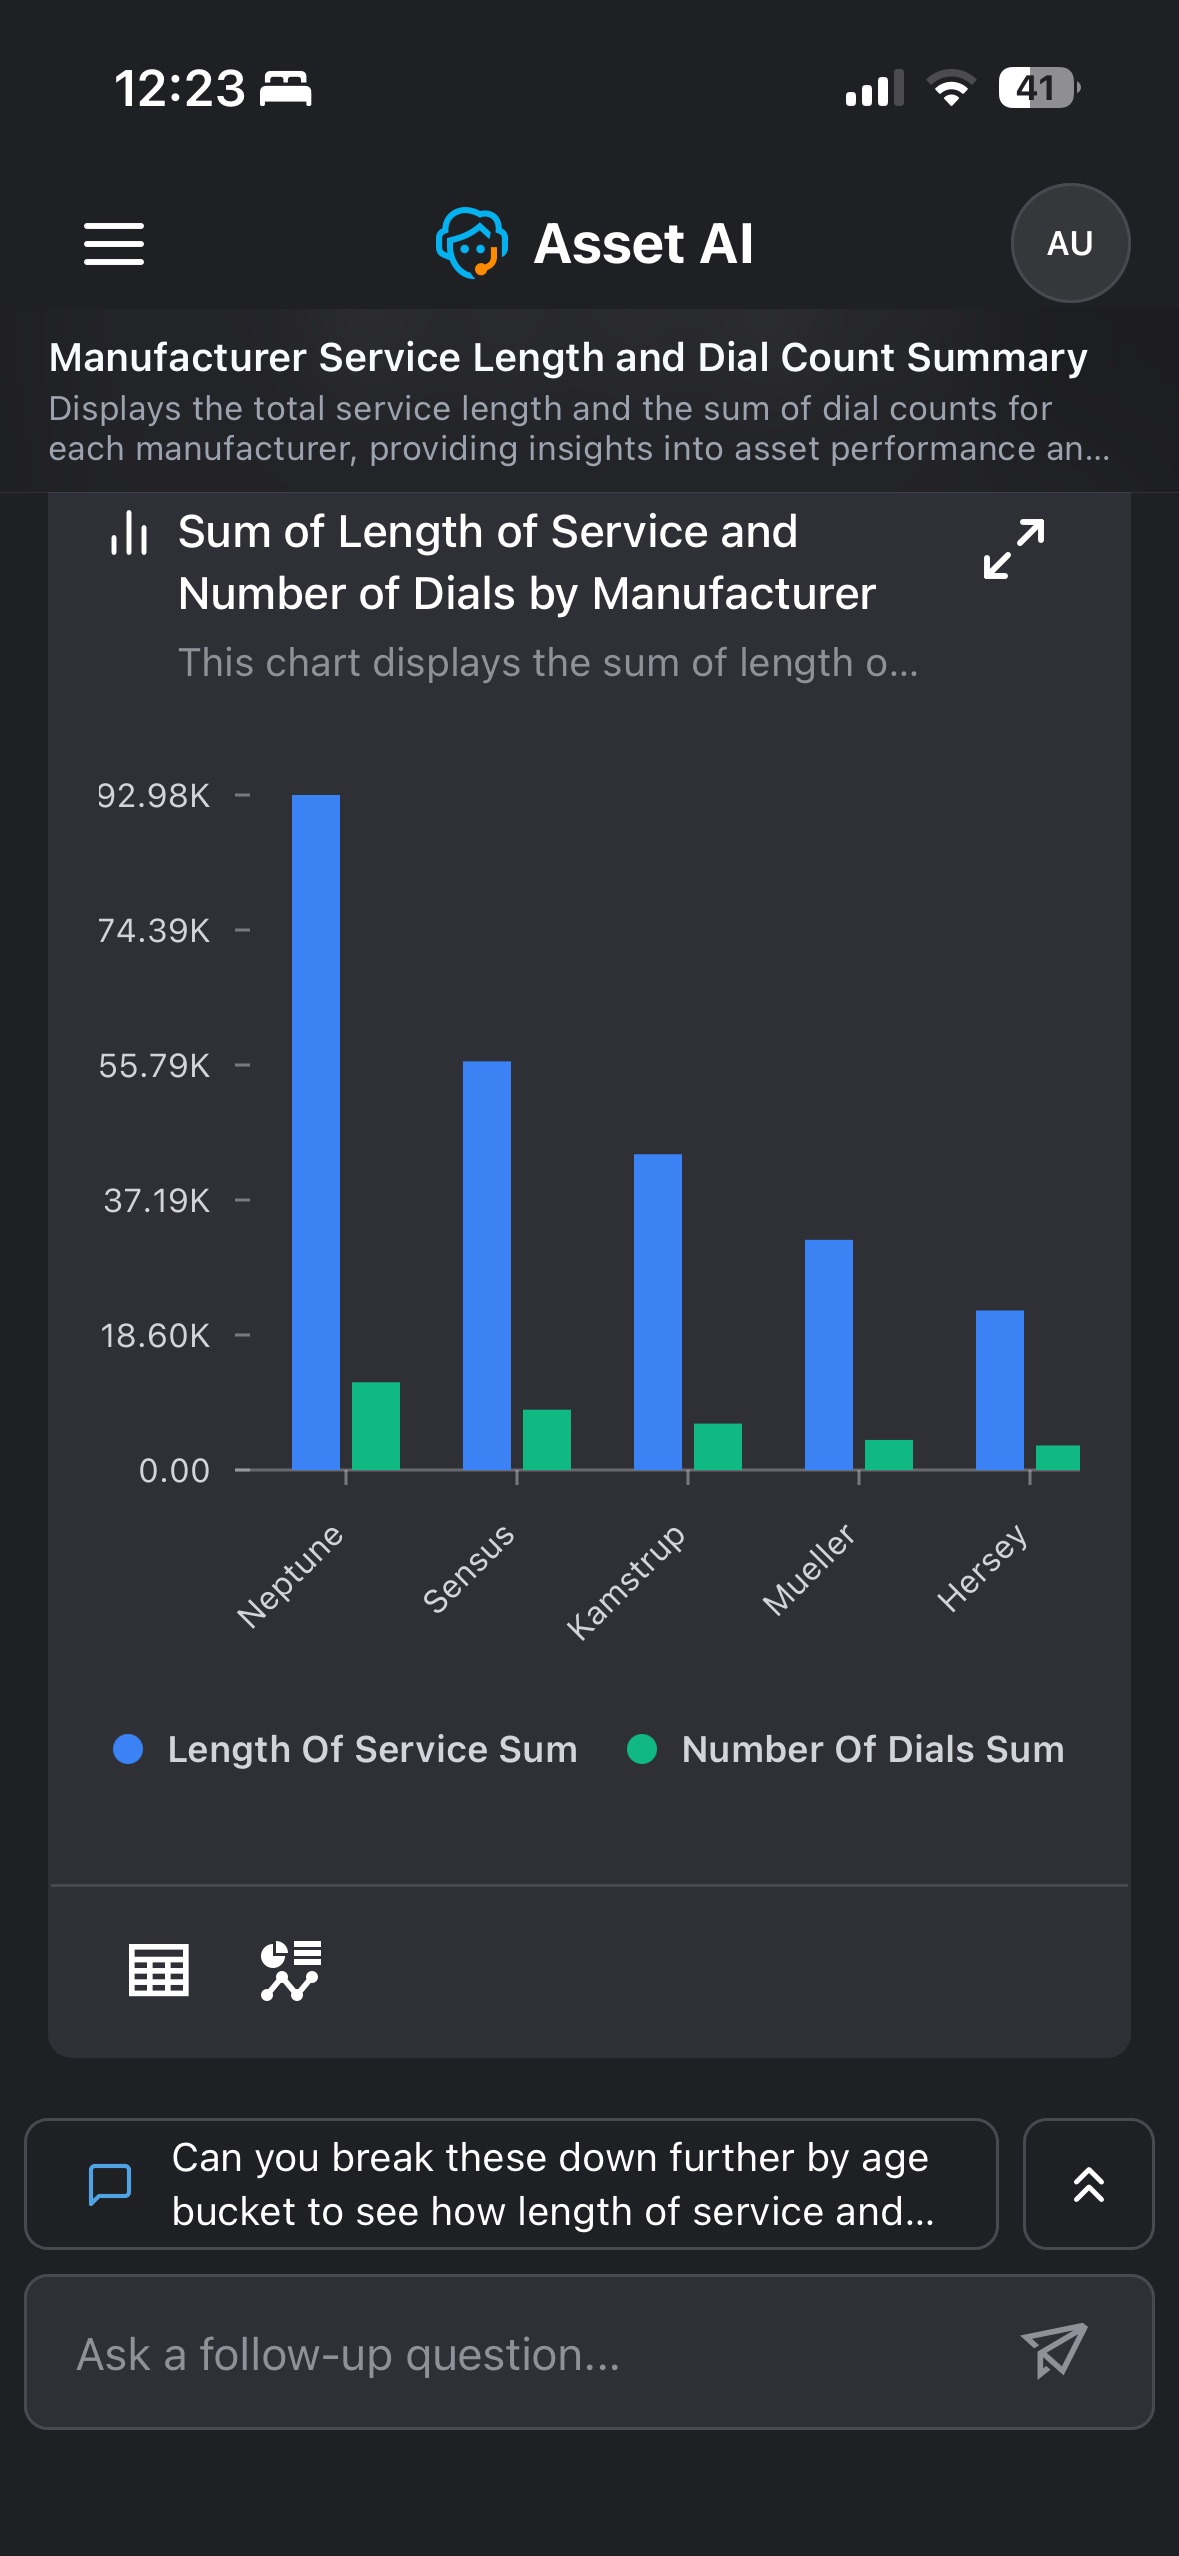
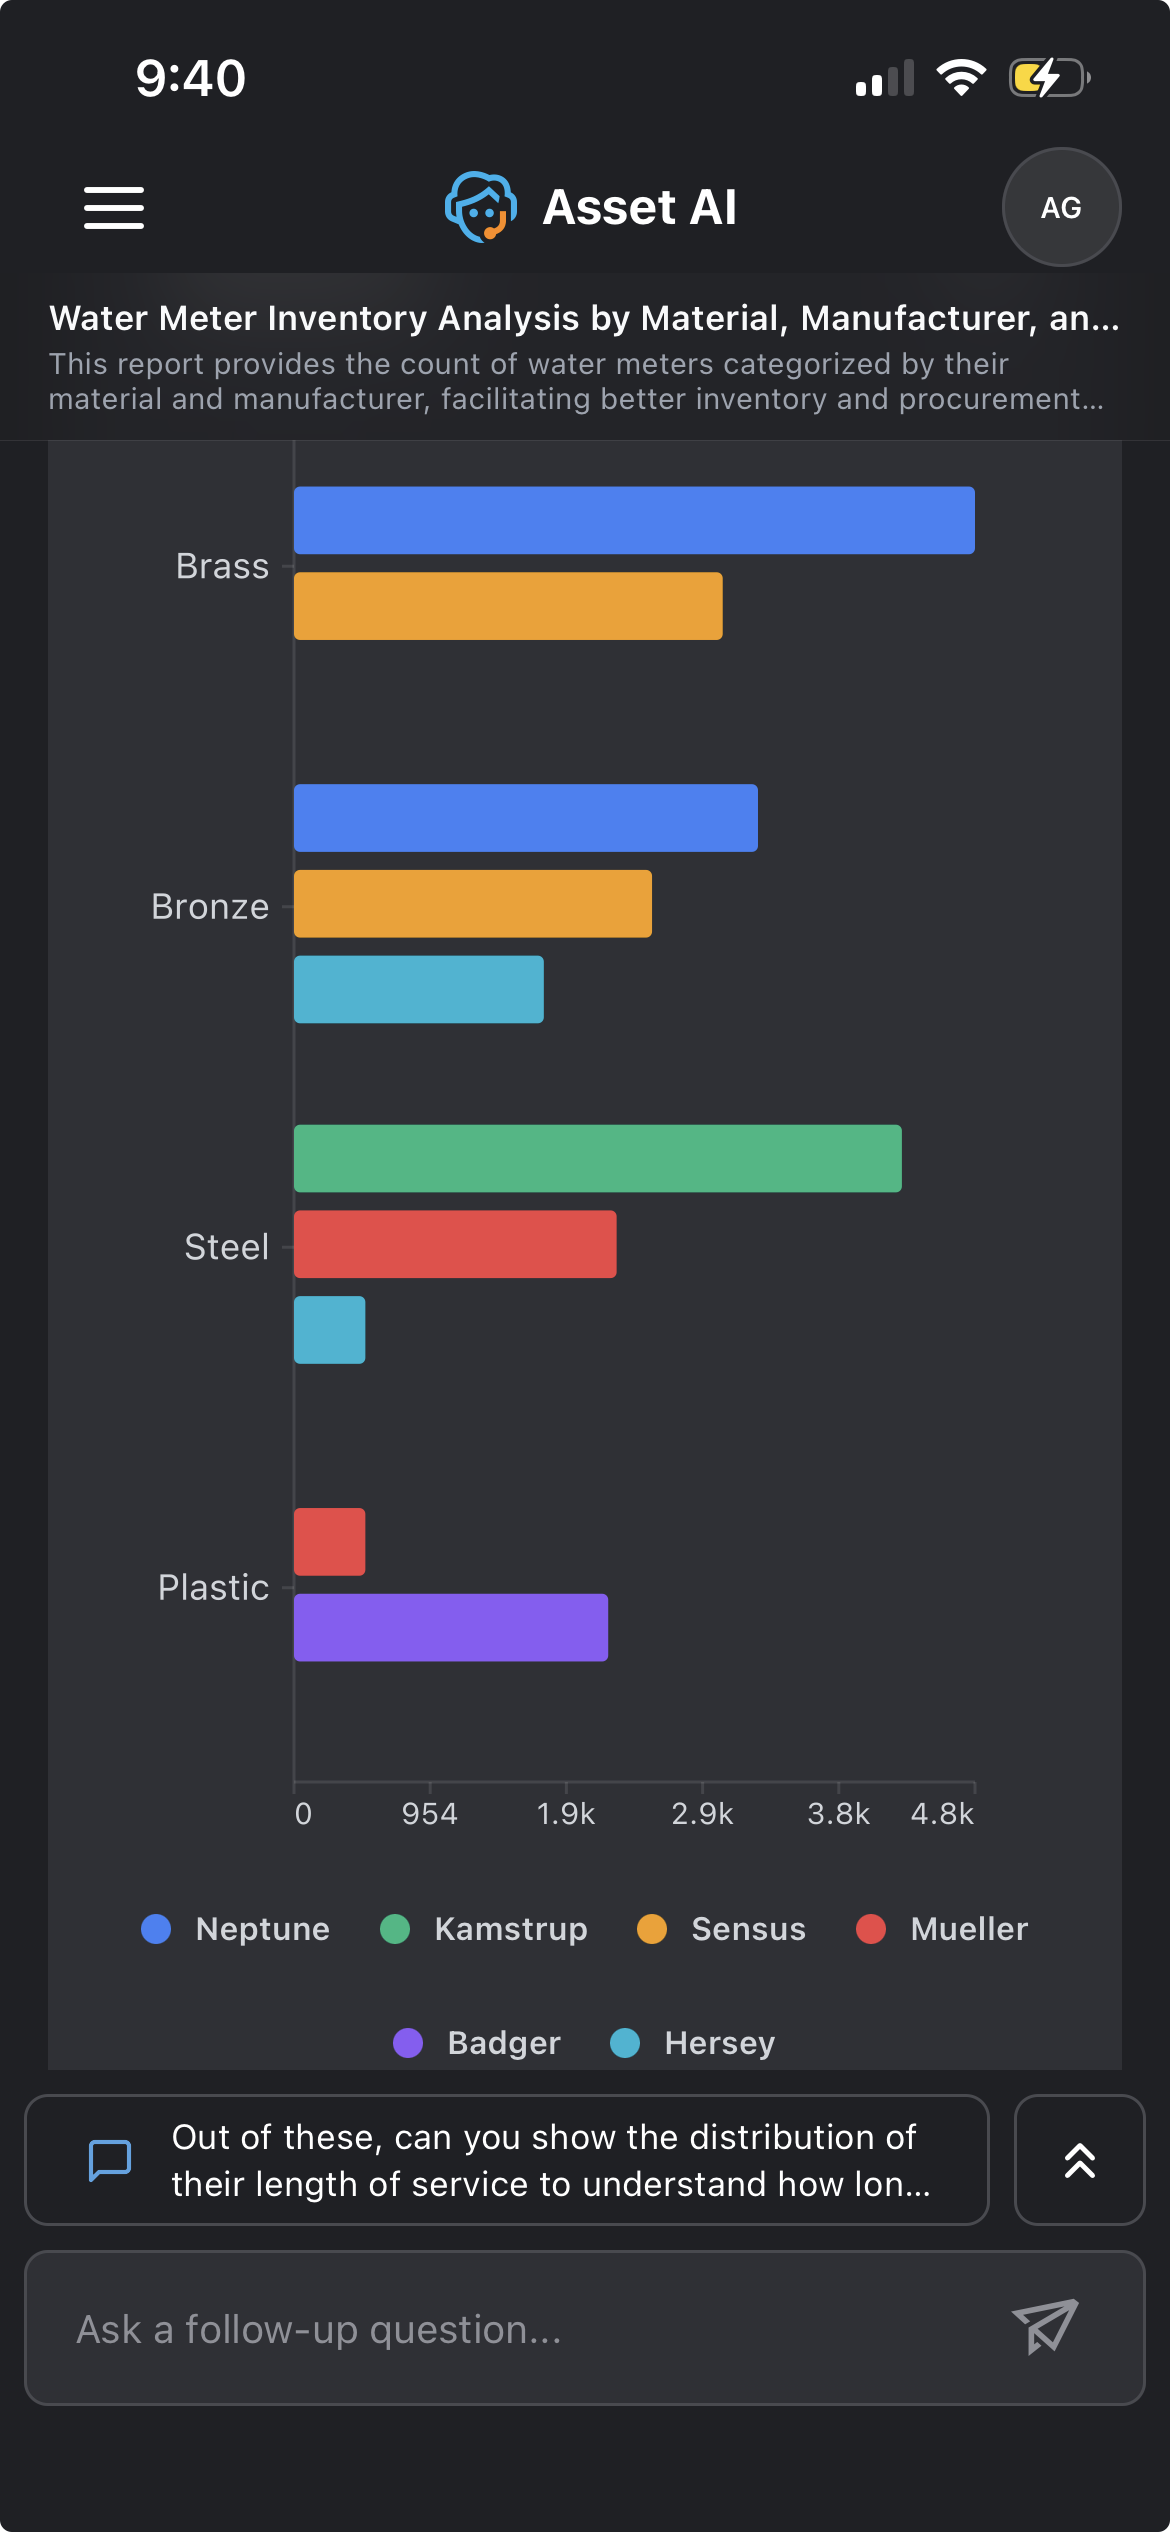
A Column (or Bar) chart is displayed when the response involves comparative data across categories or time periods. The chart includes labeled axes — the x-axis shows the categories or time periods, and the y-axis shows the count or measured value. Each column is labeled with its exact value.
Example: Asking about meter issues broken down by age bucket returns a column/bar chart comparing issue counts across Old, New, and Moderate meters.
|
Column |
Bar |
|---|---|
|
|
|
Column - Grouped |
Bar - Grouped |
|
|
Data Requirements and Question Examples
|
Visualization |
Records |
Categorical Field |
Quantitative Field |
Temporal Field |
Question Examples |
|---|---|---|---|---|---|
|
Column / Bar Chart |
3 to 5 |
1 |
1 |
|
Show count of meter issues for each material |
|
1 |
2 |
|
Show count of meters and meter issues for each material |
||
|
1 |
3 |
|
Show count of meters, meter issues and bills for each material |
||
|
6 to 10 |
1 |
1 |
|
Show count of meter issues for each manufacturer |
|
|
1 |
2 |
|
Show count of meters and meter issues for each manufacturer |
||
|
1 |
3 |
|
Show count of meters, meter issues and bills for each manufacturer |
||
|
Column / Bar Chart By Group |
3 to 5 |
2 |
1 |
|
Show count of meters for each material and manufacturer. Limit to 5 records |
|
6 to 10 |
2 |
1 |
|
Show count of meters for each material and manufacturer |
Line / Area
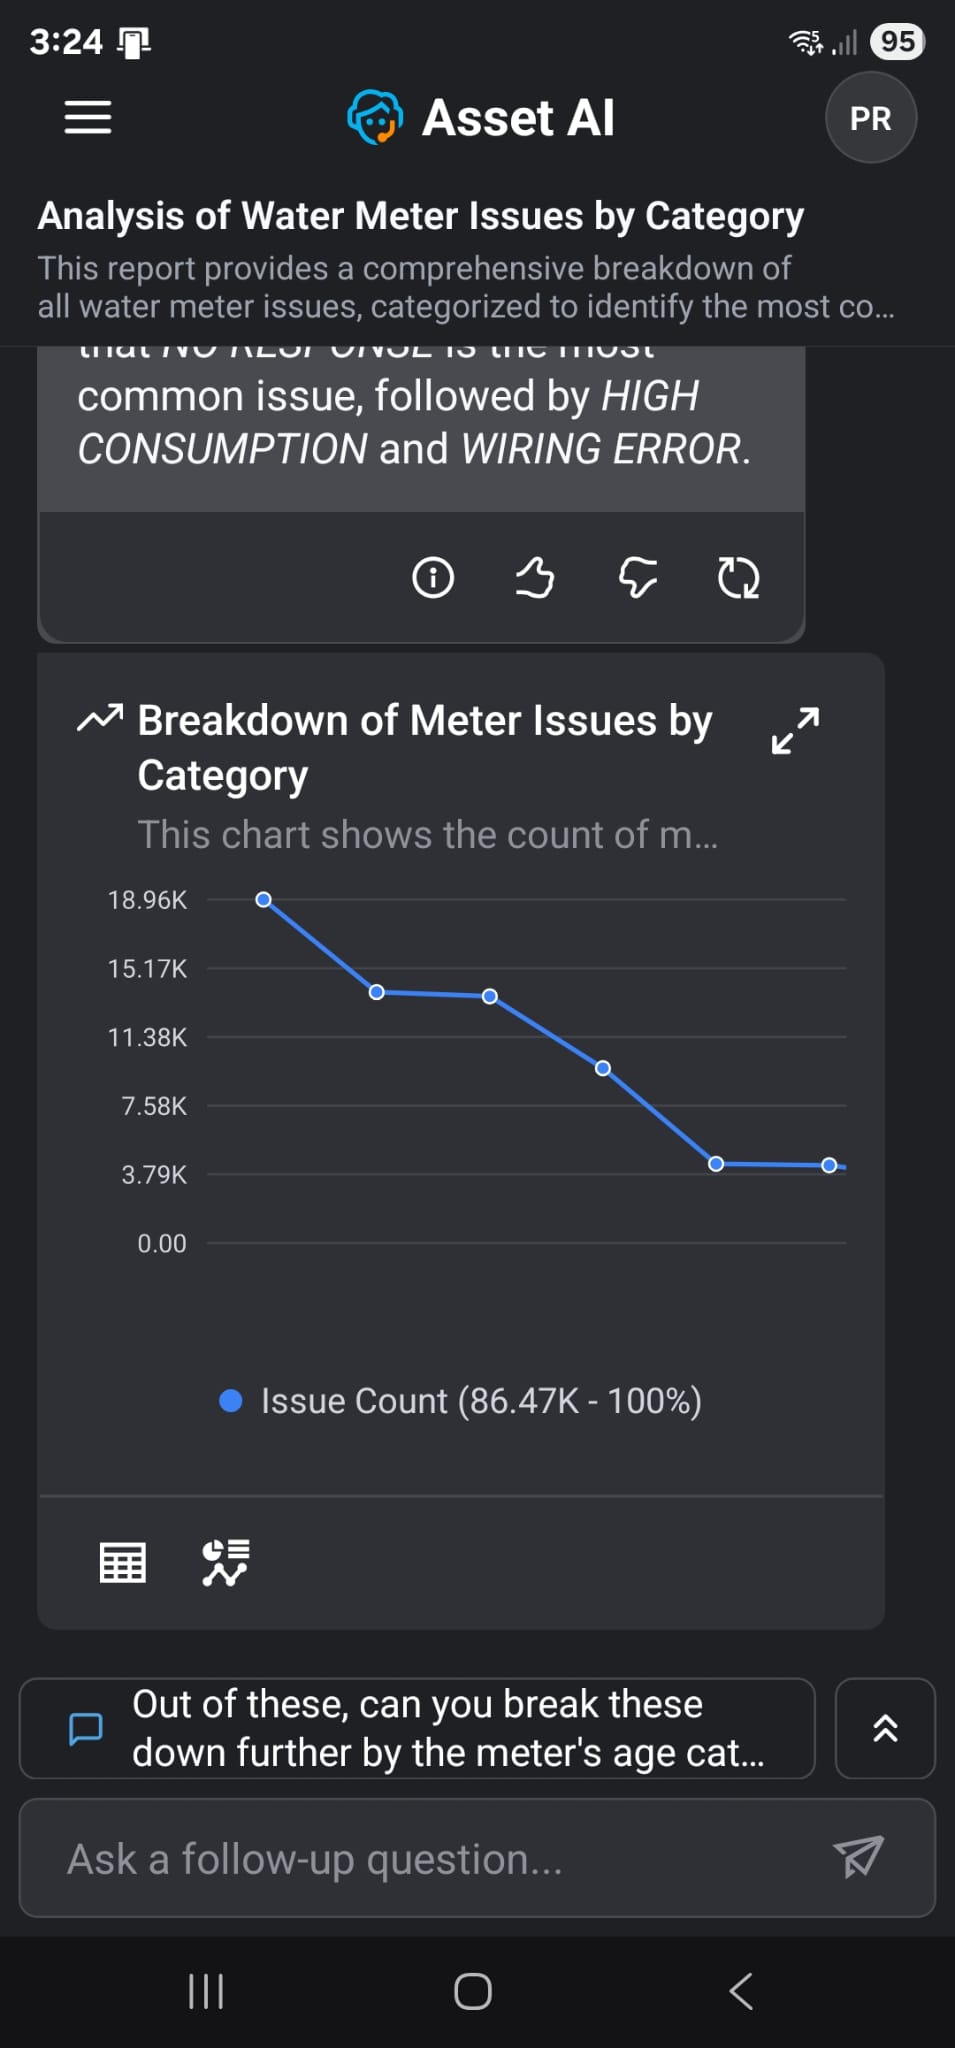
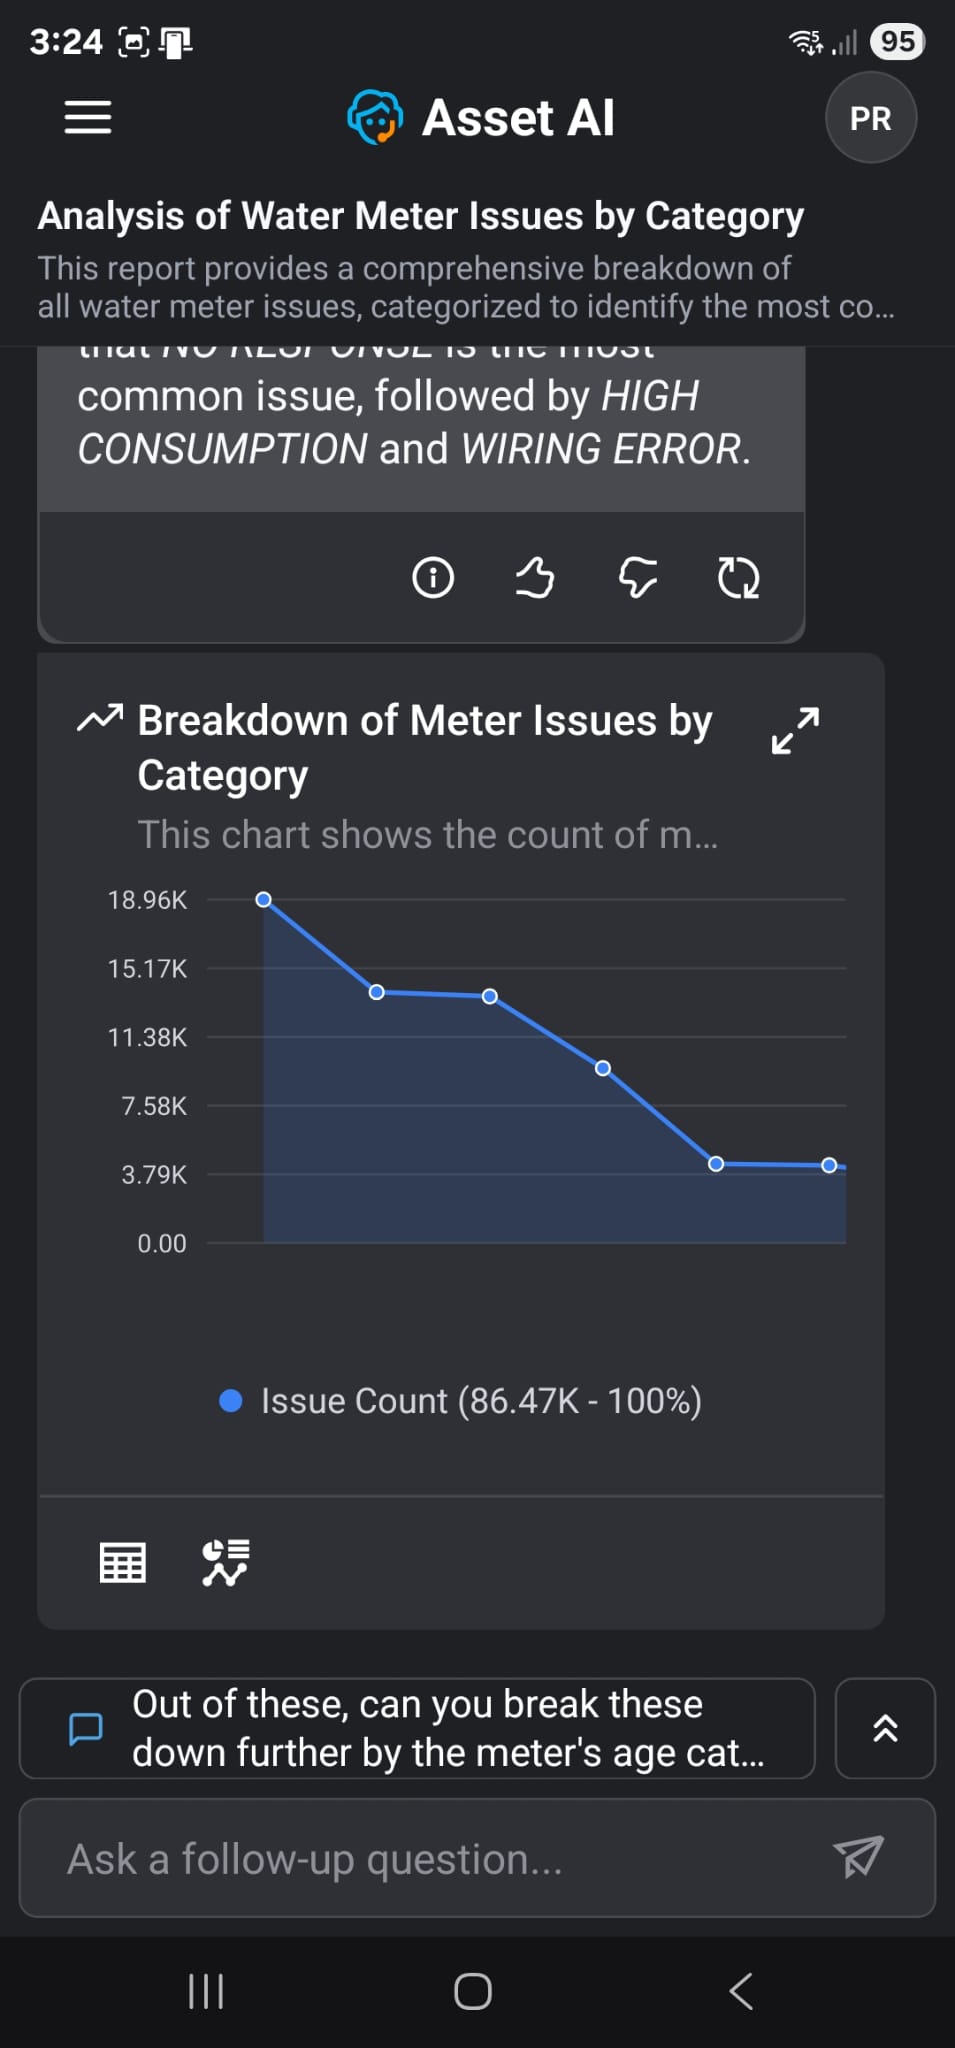
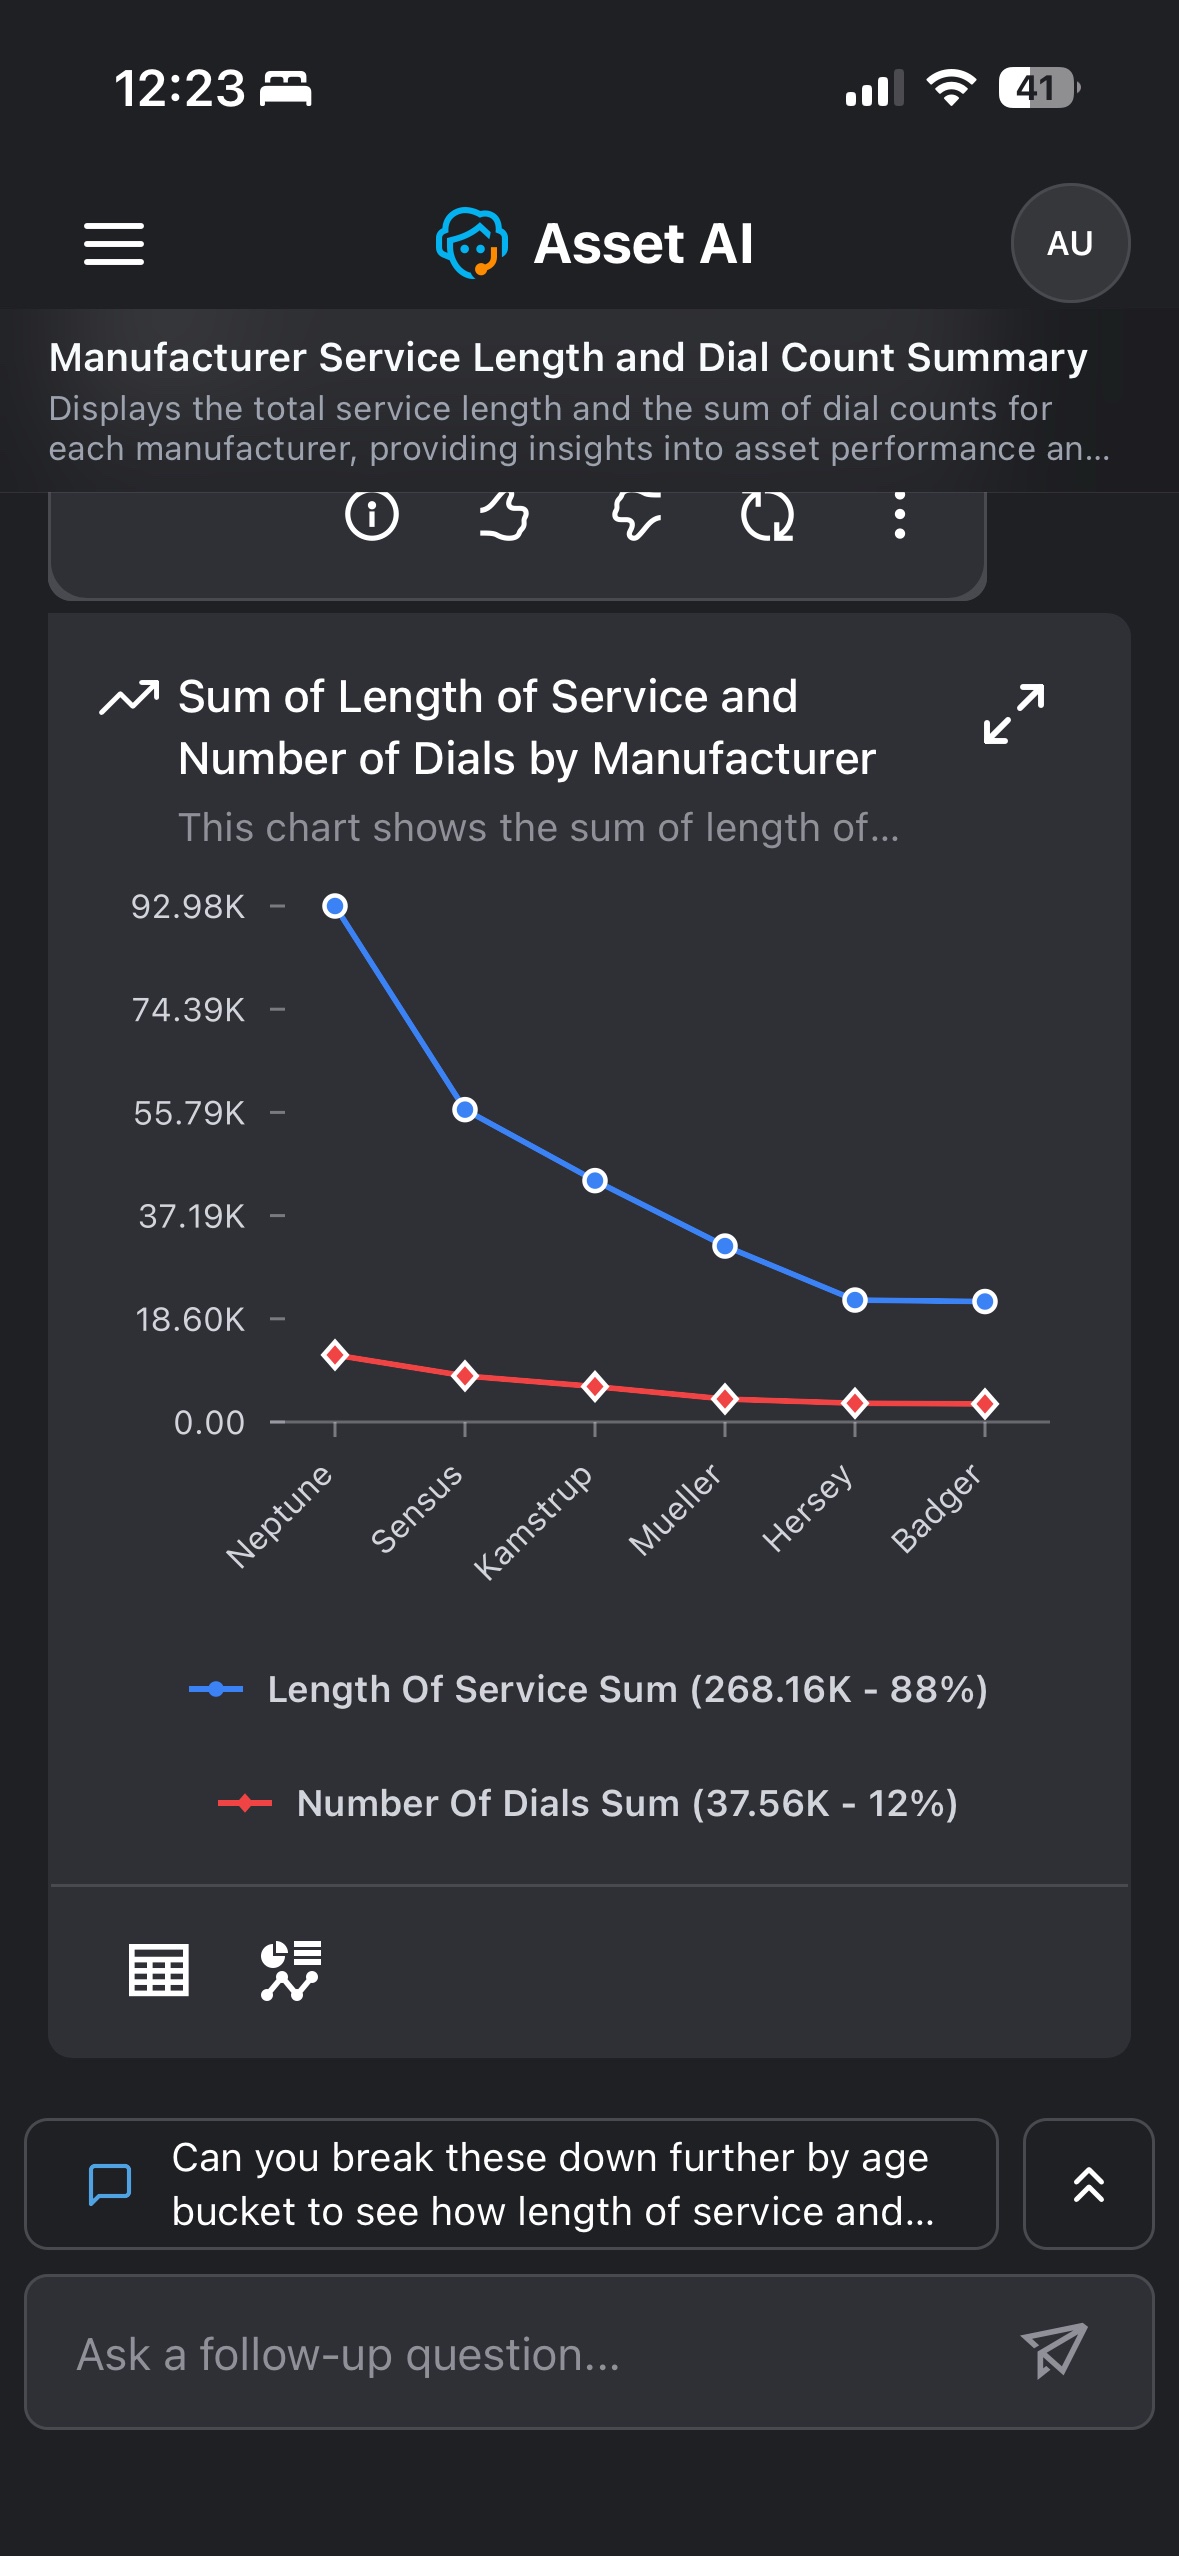
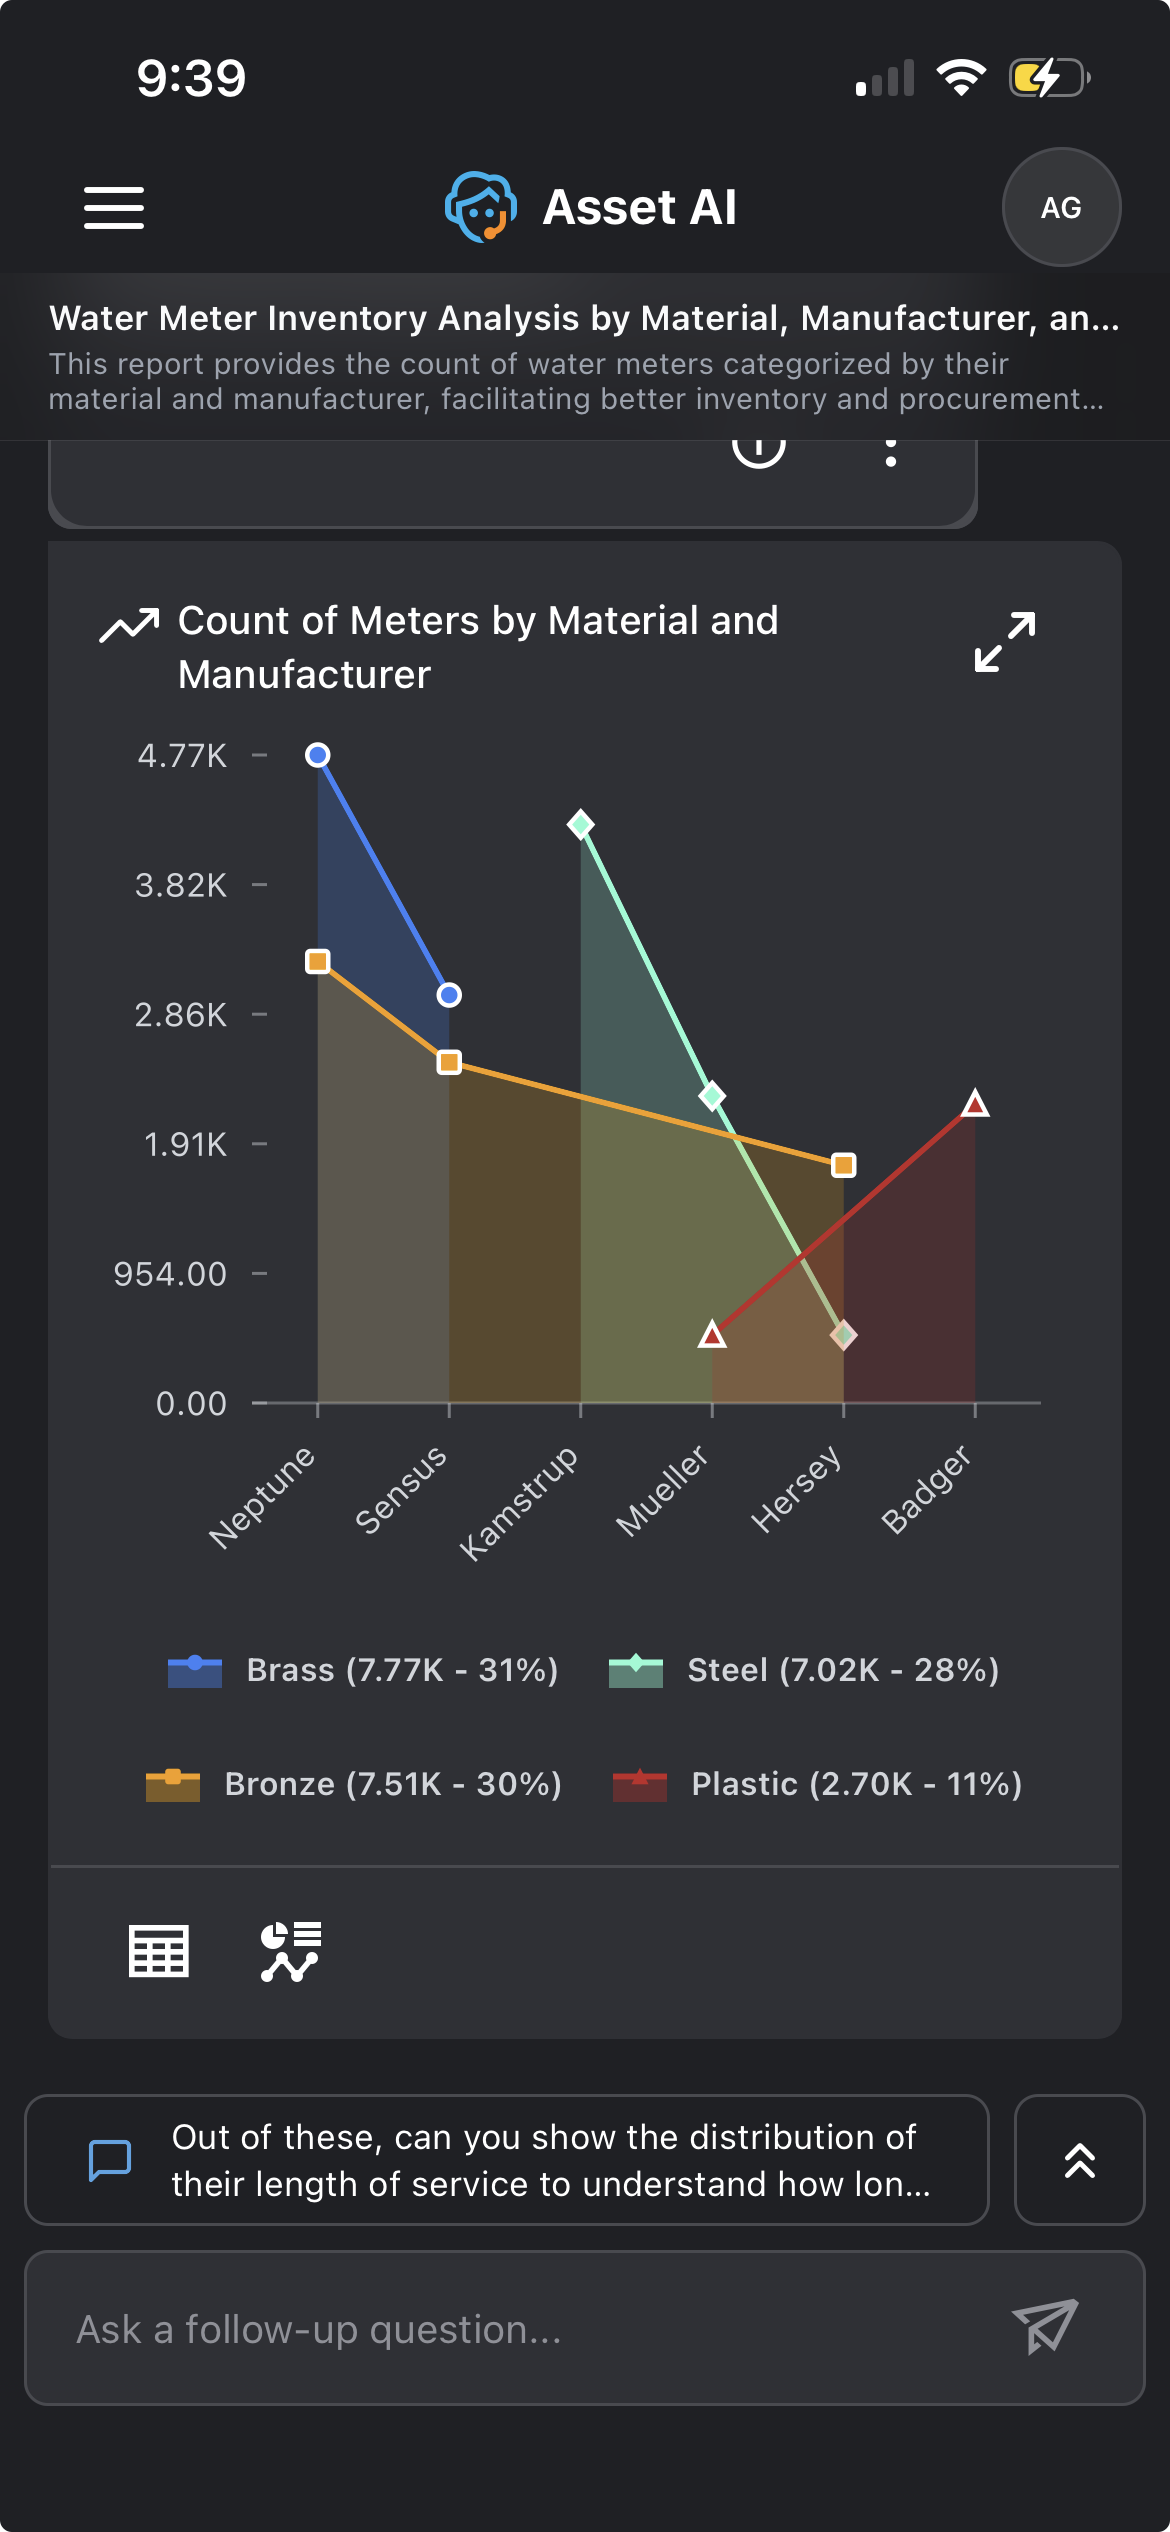
A Line (or Area) chart is displayed when the response involves a larger number of categorical values or date/time-based categories on the x-axis.
Example: Asking about monthly bill totals, therefore showing multiple individual months of bill totals in descending chronological order.
|
Line |
Area |
|---|---|
|
|
|
Line - Grouped |
Area - Grouped |
|
|
Data Requirements and Question Examples
|
Visualization |
Records |
Categorical Field |
Quantitative Field |
Temporal Field |
Question Examples |
|---|---|---|---|---|---|
|
Line Chart |
6 to 10 |
nominal: 1 |
1 |
|
Show count of meter issues by manufacturer |
|
nominal: 1 |
2 |
|
Show count of meters and bills by manufacturer |
||
|
nominal: 1 |
3 |
|
Show count of meters, meter issues and bills by manufacturer |
||
|
ordinal: 1 |
1 |
|
Show count of meter issues by age. Limit to 10 records |
||
|
ordinal: 1 |
2 |
|
Show count of meters and bills by age. Limit to 10 records |
||
|
ordinal: 1 |
3 |
|
Show count of meters, meter issues and bills by age. Limit to 10 records |
||
|
11 to 25 |
nominal: 1 |
1 |
|
Show count of meter issues by issue category |
|
|
nominal: 1 |
2 |
|
Show count of meters and bills by issue category |
||
|
nominal: 1 |
3 |
|
Show count of meters, meter issues and bills by issue category |
||
|
ordinal: 1 |
1 |
|
Show count of meter issues by age |
||
|
ordinal: 1 |
2 |
|
Show count of meters and bills by age |
||
|
ordinal: 1 |
3 |
|
Show count of meters, meter issues and bills by age |
||
|
Line Chart By Group |
3 to 5 |
2 |
1 |
|
Show count of meters for each material and manufacturer. Limit to 5 records |
|
6 to 10 |
2 |
1 |
|
Show count of meters for each material and manufacturer |
|
|
11 to 25 |
2 |
1 |
|
Show count of meters for each material and issue category. Limit to 25 records |
|
|
Area Chart |
6 to 10 |
1 |
1 |
|
Show count of meter issues for each manufacturer |
|
1 |
2 |
|
Show count of meters and meter issues for each manufacturer |
||
|
1 |
3 |
|
Show count of meters, meter issues and bills for each manufacturer |
||
|
11 to 25 |
1 |
1 |
|
Show count of meter issues for each issue category |
|
|
1 |
2 |
|
Show count of meters and meter issues for each issue category |
||
|
1 |
3 |
|
Show count of meters, meter issues and bills for each issue category |
||
|
6 to 10 |
|
1 |
1 |
Show count of meter issues for each year. Limit to 10 records |
|
|
|
2 |
1 |
Show count of meters and meter issues for each manufacturing year. Limit to 10 records |
||
|
|
3 |
1 |
Show count of meters, meter issues and bills for each manufacturing year. Limit to 10 records |
||
|
11 to 25 |
|
1 |
1 |
Show count of meter issues for each year |
|
|
|
2 |
1 |
Show count of meters and meter issues for each manufacturing year |
||
|
|
3 |
1 |
Show count of meters, meter issues and bills for each manufacturing year |
||
|
Area Chart By Group |
3 to 5 |
2 |
1 |
|
Show count of meters for each material and manufacturer. Limit to 5 records |
|
6 to 10 |
2 |
1 |
|
Show count of meters for each material and manufacturer |
|
|
11 to 25 |
2 |
1 |
|
Show count of meters for each material and issue category. Limit to 25 records |
Scatter / Bubble
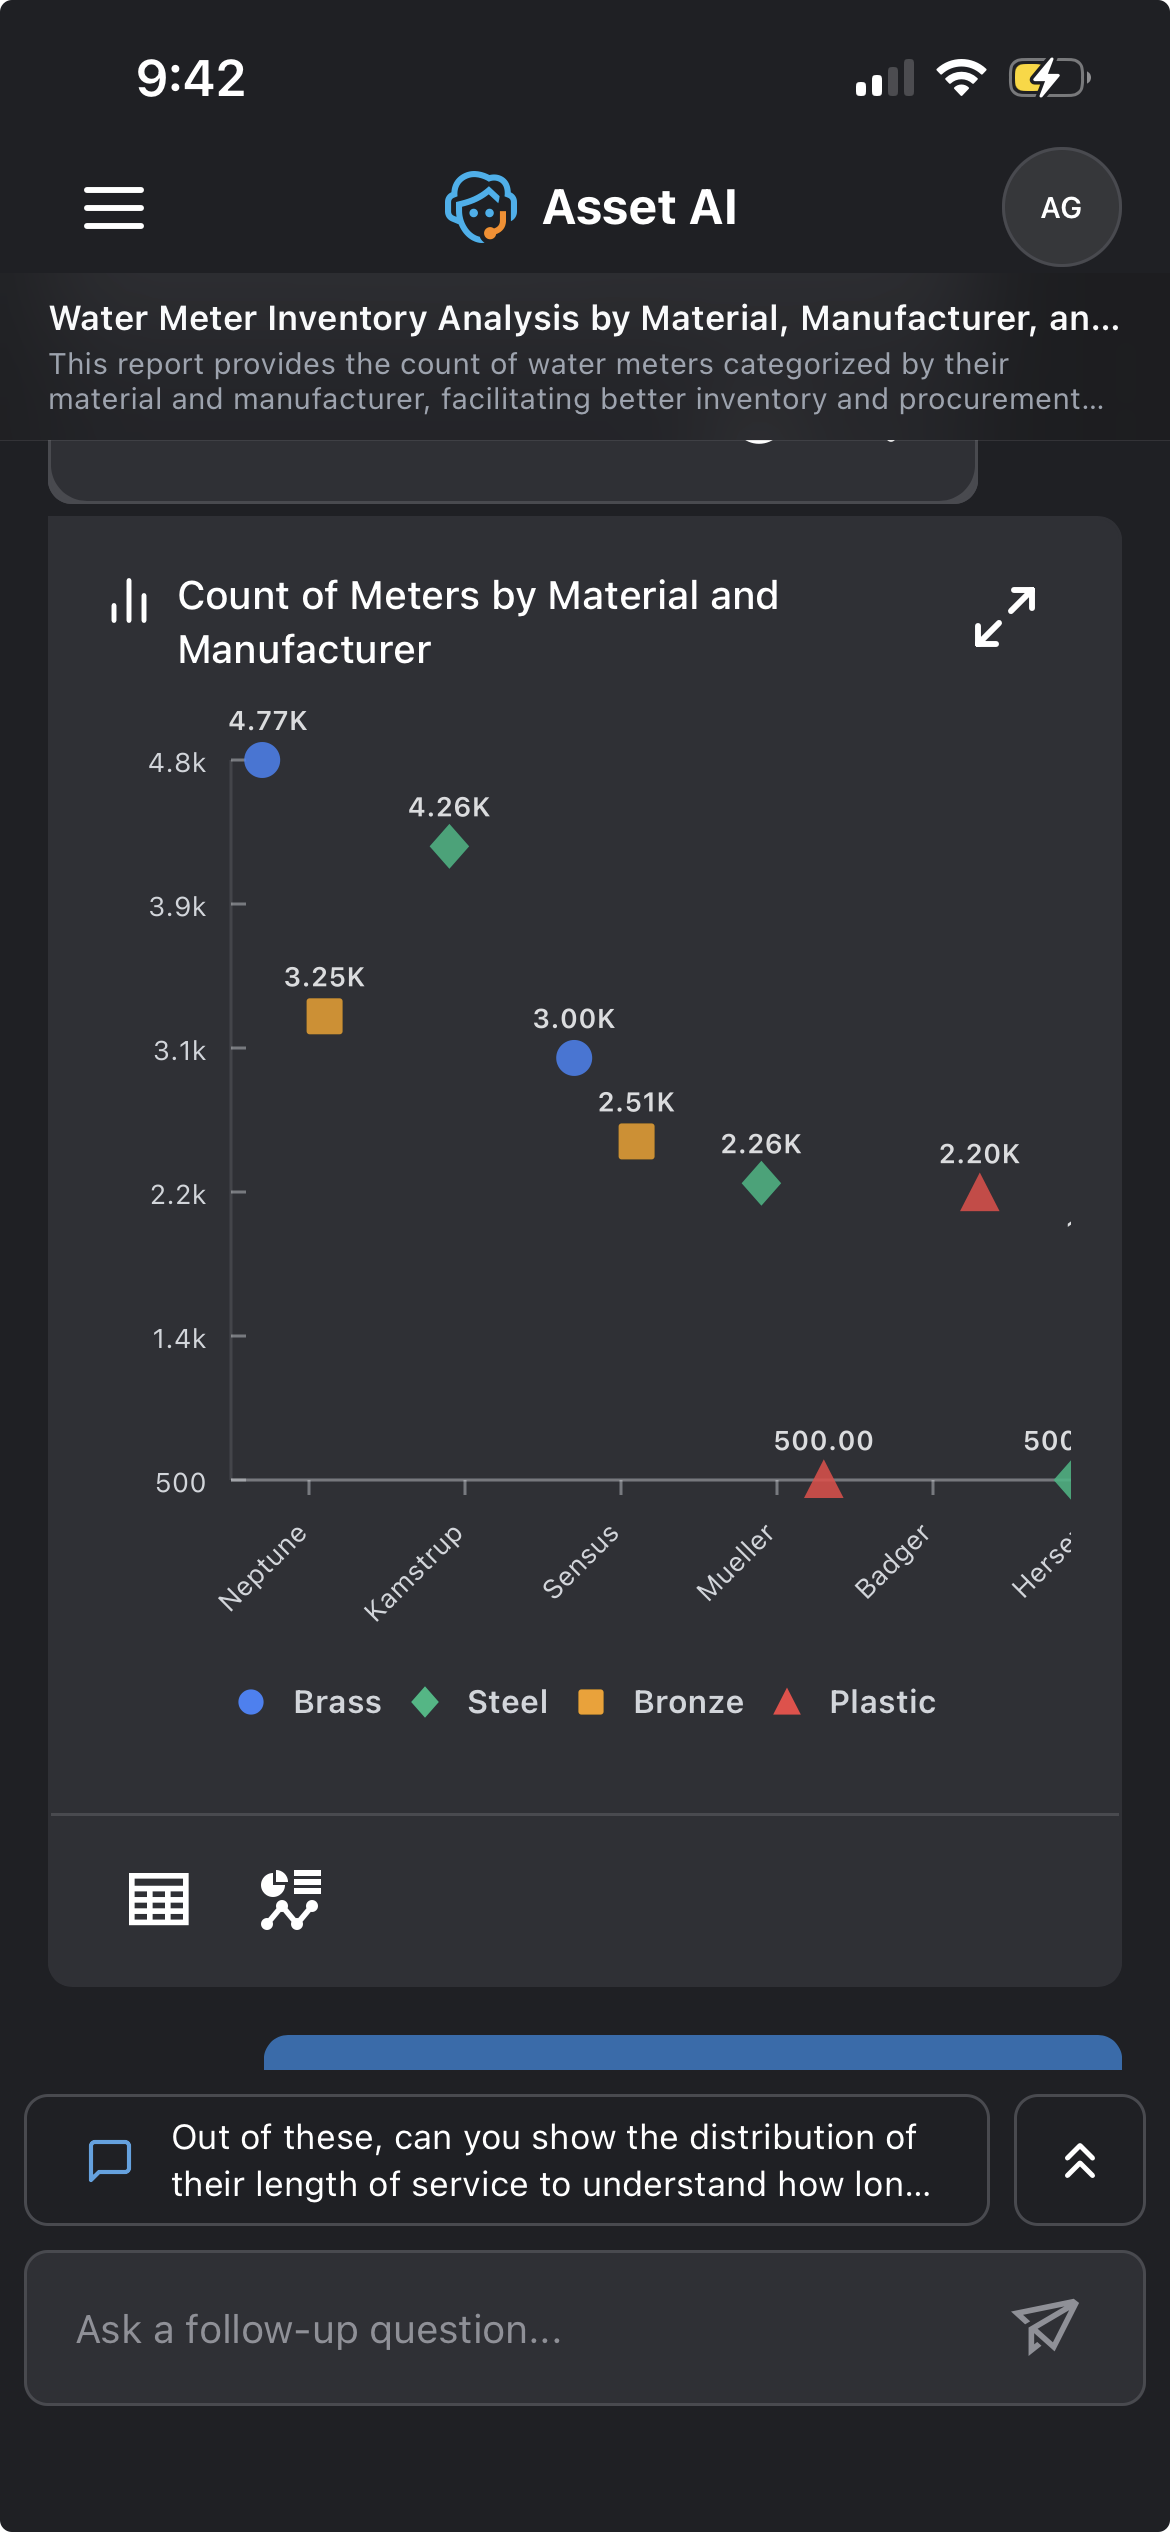
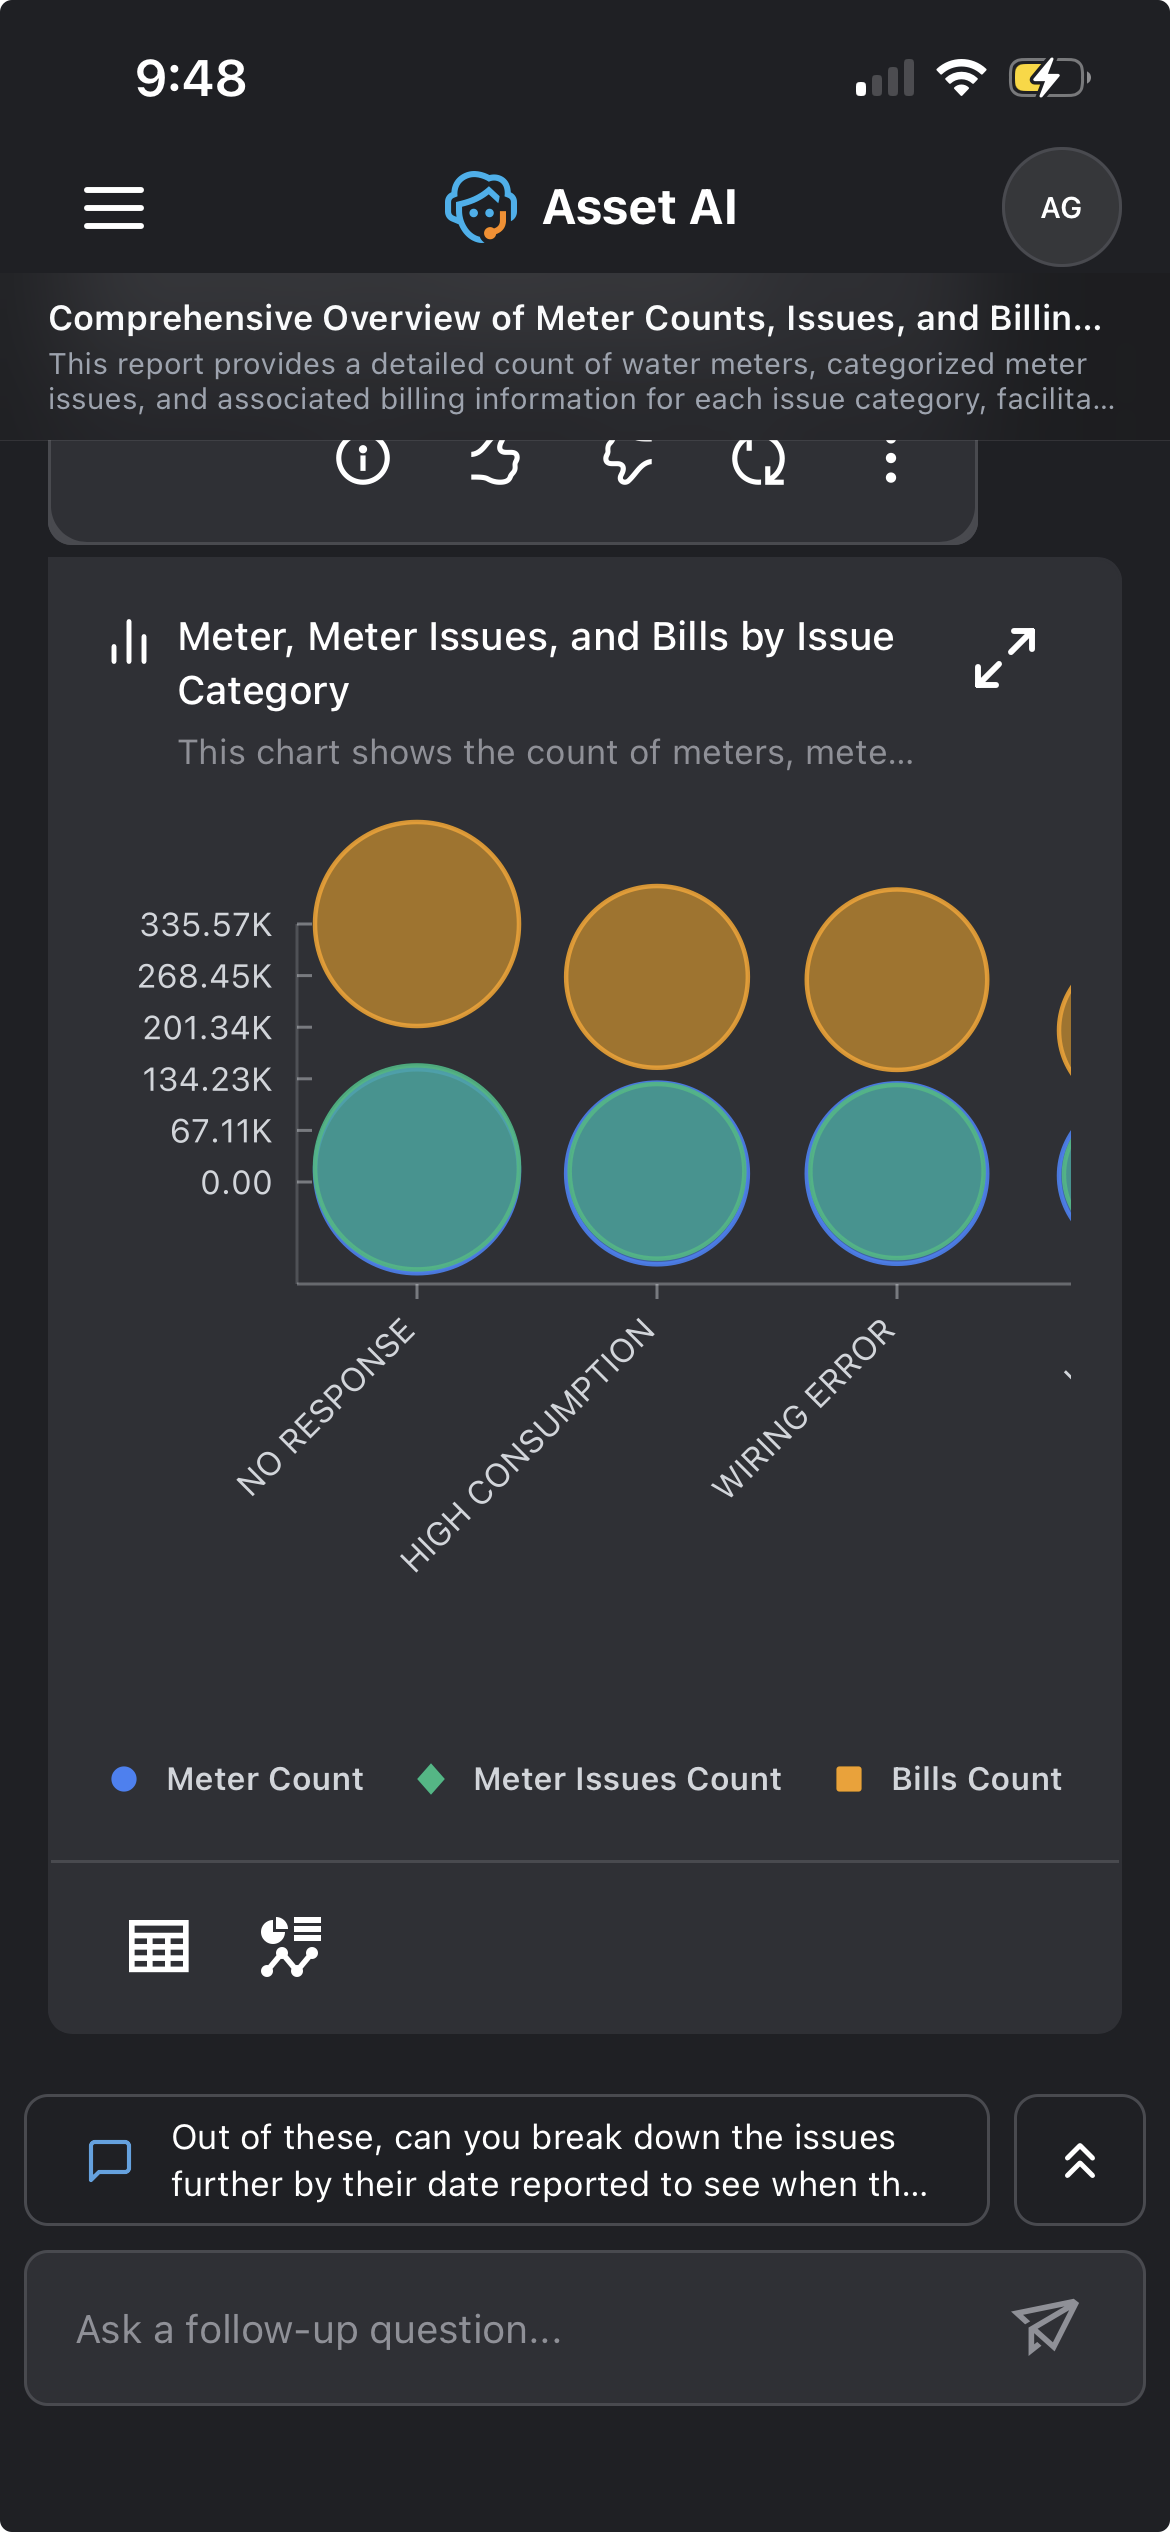
A Scatter (or Bubble) chart is displayed when the response compares a count or value across categories, with a second category or measure shown using different colors or marker shapes. This makes it easier to compare many category combinations than a grouped Column or Bar chart would.
Example: Asking about meter counts by material and manufacturer returns a scatter chart with manufacturers on the x-axis and a different colored marker for each material. Asking about meter counts, meter issue counts, and bill counts by issue category returns a bubble chart with issue categories on the x-axis and a different colored marker for each measure.
|
Scatter |
Bubble |
|---|---|
|
|
Data Requirements and Question Examples
|
Visualization |
Records |
Categorical Field |
Quantitative Field |
Temporal Field |
Question Examples |
|---|---|---|---|---|---|
|
Scatter Chart |
11 to 25 |
1 |
1 |
|
Show count of meter issues for each issue category |
|
1 |
2 |
|
Show count of meters and meter issues for each issue category |
||
|
1 |
3 |
|
Show count of meters, meter issues and bills for each issue category |
||
|
26 to 100 |
1 |
1 |
|
Show count of meter issues for each batch. Limit to 100 records |
|
|
1 |
2 |
|
Show count of meters and meter issues for each batch. Limit to 100 records |
||
|
1 |
3 |
|
Show count of meters, meter issues and bills for each batch. Limit to 100 records |
||
|
101 to 1000 |
1 |
1 |
|
Show count of meter issues for each batch. Limit to 1000 records |
|
|
1 |
2 |
|
Show count of meters and meter issues for each batch. Limit to 1000 records |
||
|
1 |
3 |
|
Show count of meters, meter issues and bills for each batch. Limit to 1000 records |
||
|
1001 to 5000 |
1 |
1 |
|
Show count of meter issues for each batch. Limit to 5000 records |
|
|
1 |
2 |
|
Show count of meters and meter issues for each batch. Limit to 5000 records |
||
|
1 |
3 |
|
Show count of meters, meter issues and bills for each batch. Limit to 5000 records |
||
|
Scatter Chart By Group |
3 to 5 |
2 |
1 |
|
Show count of meters for each material and manufacturer. Limit to 5 records |
|
6 to 10 |
2 |
1 |
|
Show count of meters for each material and manufacturer |
|
|
11 to 25 |
2 |
1 |
|
Show count of meters for each material and issue category. Limit to 25 records |
|
|
Bubble Chart |
6 to 10 |
1 |
2 |
|
Show count of meters and meter issues for each manufacturer |
|
1 |
3 |
|
Show count of meters, meter issues and bills by manufacturer |
||
|
1 |
4 |
|
Show count of meters, meter issues, bills and service orders by manufacturer |
||
|
11 to 25 |
1 |
2 |
|
Show count of meters and bills for each issue category |
|
|
1 |
3 |
|
Show count of meters, meter issues and bills by issue category |
||
|
1 |
4 |
|
Show count of meters, meter issues, number of dials and total length of service for each issue category |
Waffle
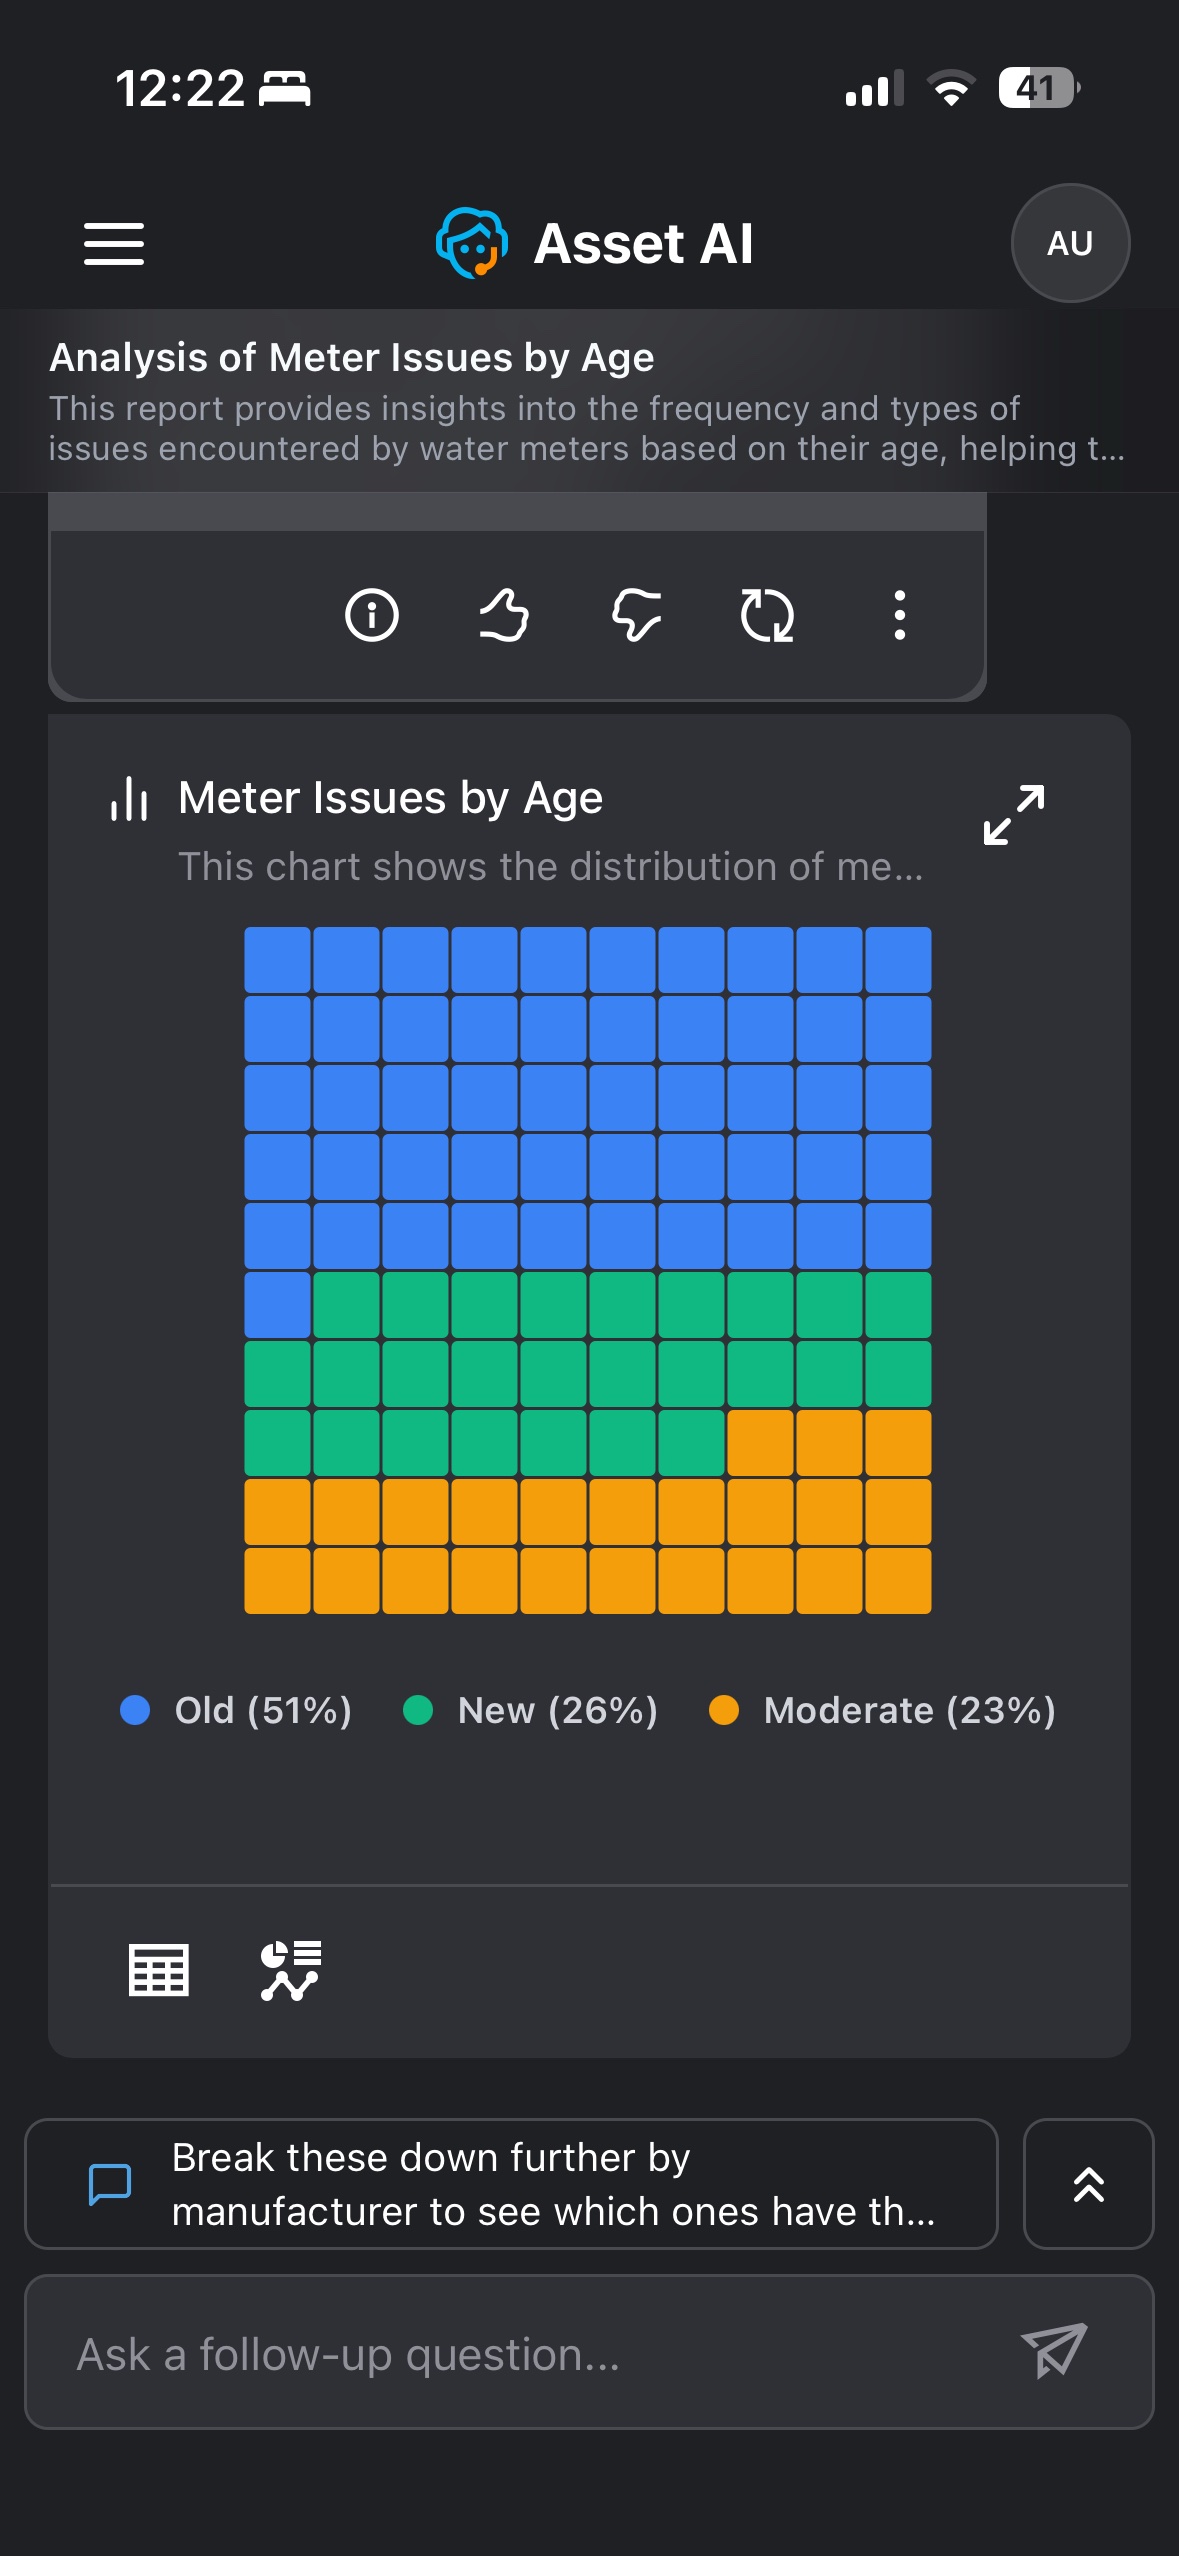
The Waffle chart is displayed when the response involves proportional or percentage-based distribution across categories, shown as a grid of squares where each square represents a share of the total. It offers a compact alternative to a Pie or Donut chart for comparing category shares.
Example: Asking about meter issues broken down by age returns a waffle chart showing the percentage share of issues from Old (51%), New (26%), and Moderate (23%) meters, with the legend giving each category's exact percentage.
Data Requirements and Question Examples
|
Visualization |
Records |
Categorical Field |
Quantitative Field |
Temporal Field |
Question Examples |
|---|---|---|---|---|---|
|
|
|
|
|
|
|
Radar
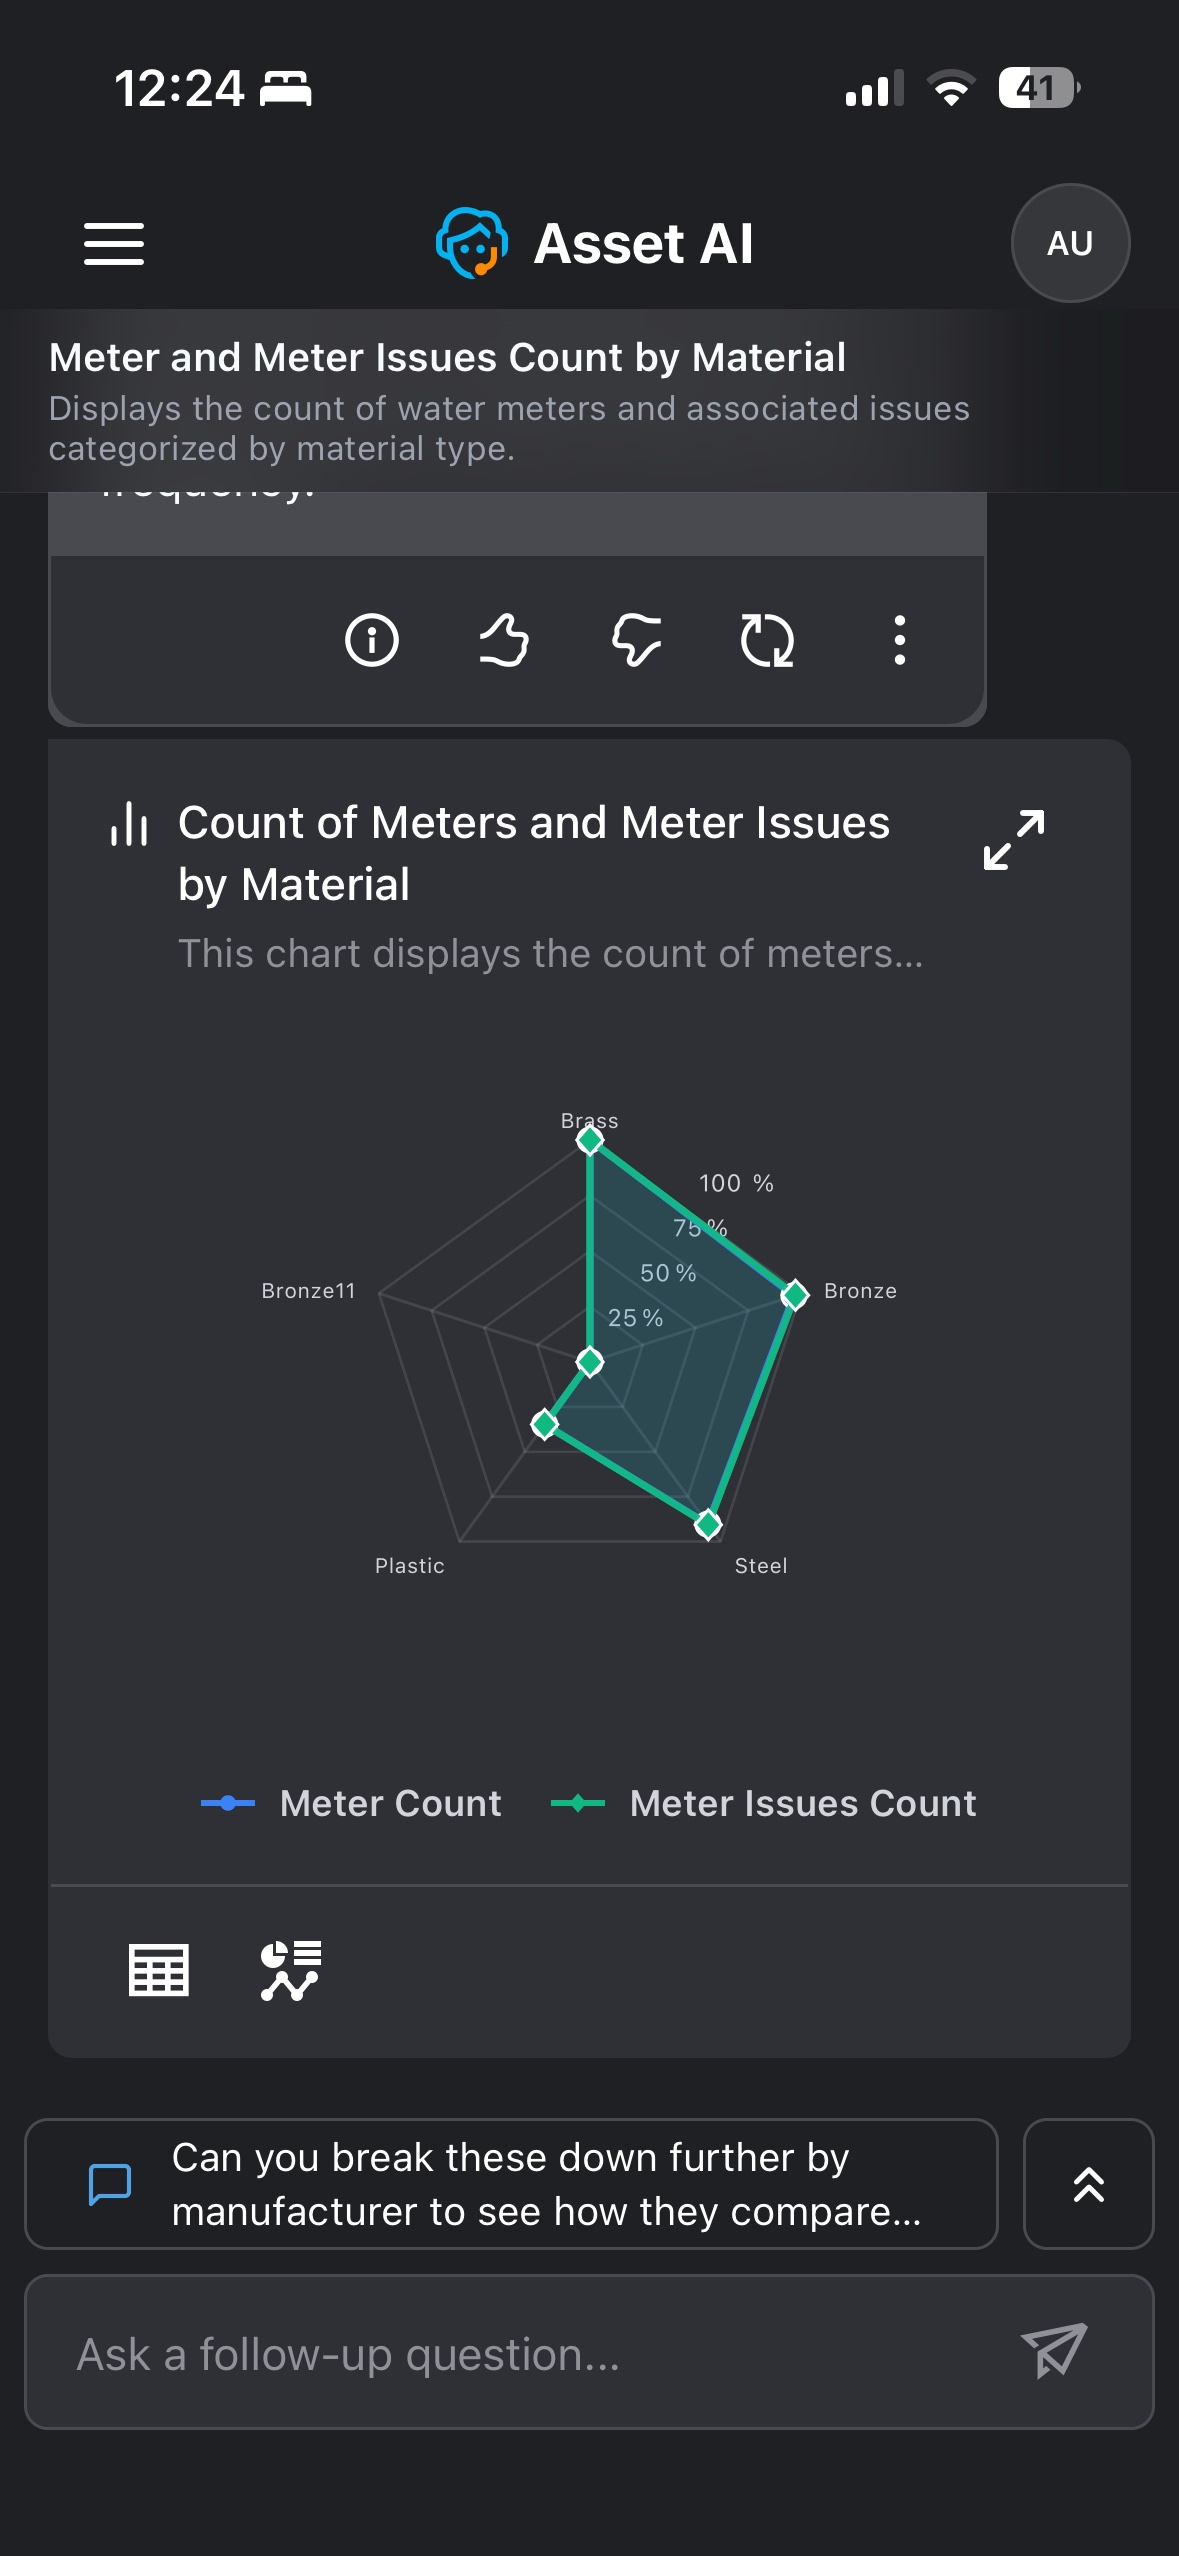
The Radar chart is displayed when the response compares one or more numeric measures across several categories. Each category gets its own axis radiating from the center, and each measure is drawn as a shape connecting its values across all the axes.
Example: Asking about meter counts and meter issue counts broken down by material returns a radar chart with an axis for each material (Brass, Bronze, Steel, Plastic), and a separate shape showing how Meter Count and Meter Issues Count vary across materials.
Data Requirements and Question Examples
|
Visualization |
Records |
Categorical Field |
Quantitative Field |
Temporal Field |
Question Examples |
|---|---|---|---|---|---|
|
Radar Chart |
3 to 5 |
1 |
1 |
|
show length of service sum & number of dials sum for each age |
|
1 |
3 |
|
show length of service sum & number of dials sum for each age |
||
|
6 to 10 |
1 |
2 |
|
show length of service sum & number of dials sum for each manufacturer |
|
|
1 |
3 |
|
show meter count, length of service sum & number of dials sum for each manufacturer |
Radial Bar
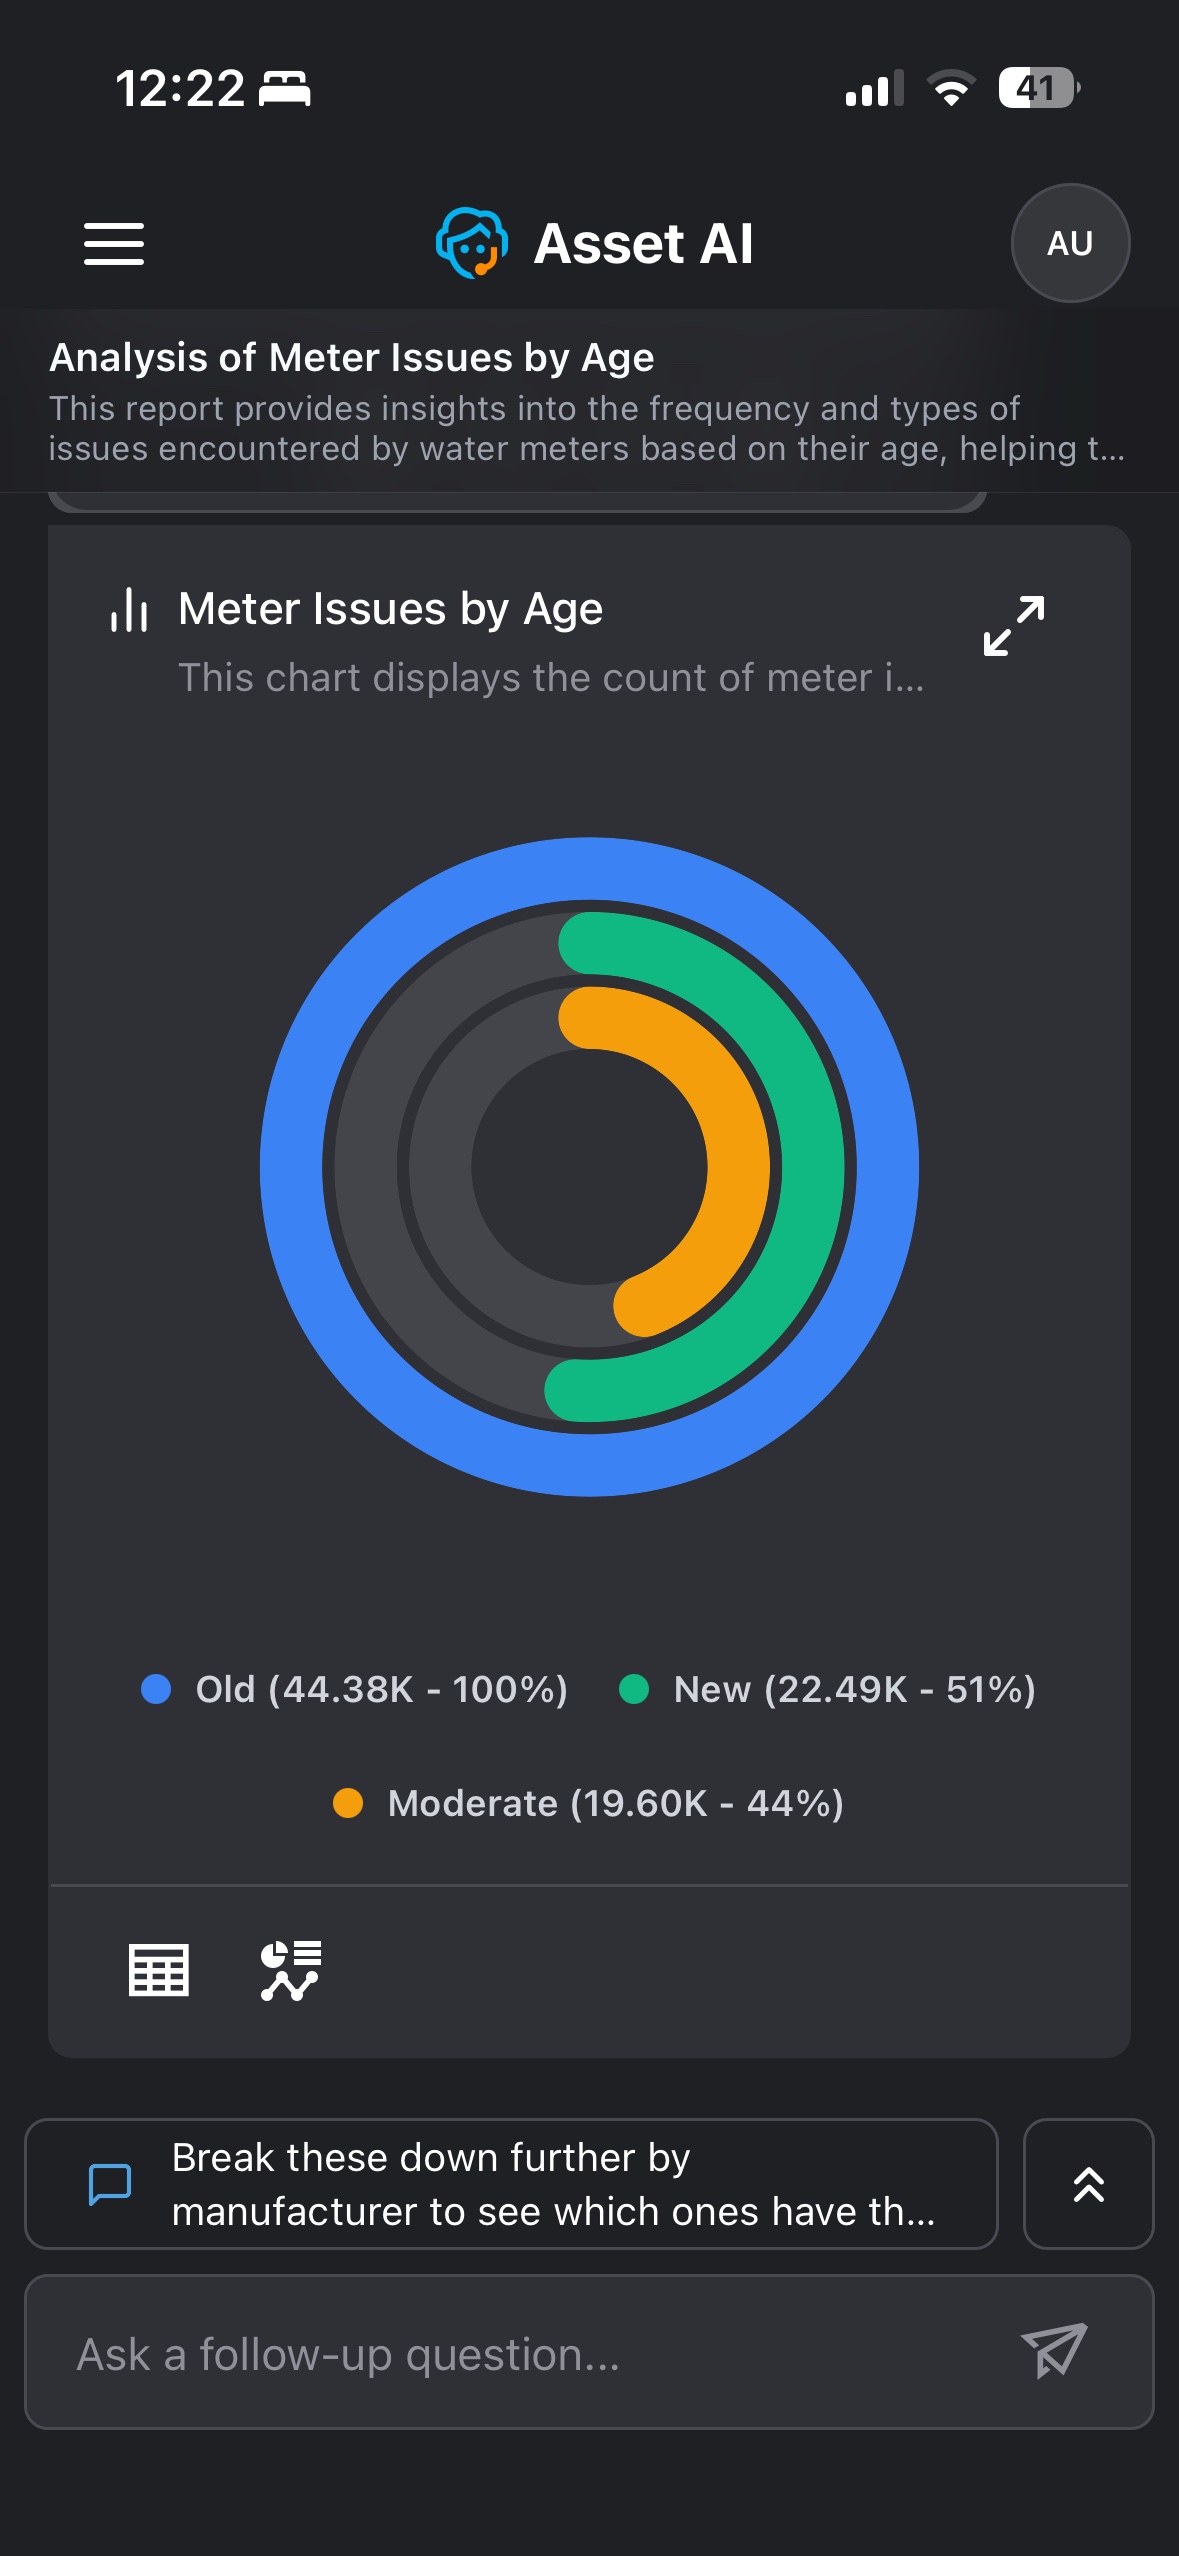
The Radial Bar chart is displayed when the response compares values across categories, shown as concentric rings around a center point. Each ring's arc length shows that category's value as a percentage of the largest category, making it easy to see how far behind the others fall.
Example: Asking about meter issues broken down by age returns a radial bar chart with a ring for Old, New, and Moderate meters. Old is drawn as a full ring (44.38K, 100%), while New (22.49K, 51%) and Moderate (19.60K, 44%) are shown as shorter arcs relative to it.
Data Requirements and Question Examples
|
Visualization |
Records |
Categorical Field |
Quantitative Field |
Temporal Field |
Question Examples |
|---|---|---|---|---|---|
|
Radial Bar |
3 to 5 |
1 |
1 |
|
show length of service sum for each age |
|
1 |
2 |
|
show length of service sum & number of dials sum for each age |
||
|
6 to 10 |
1 |
1 |
|
show length of service sum for each manufacturer |
|
|
1 |
2 |
|
show length of service sum & number of dials sum for each manufacturer |
Funnel
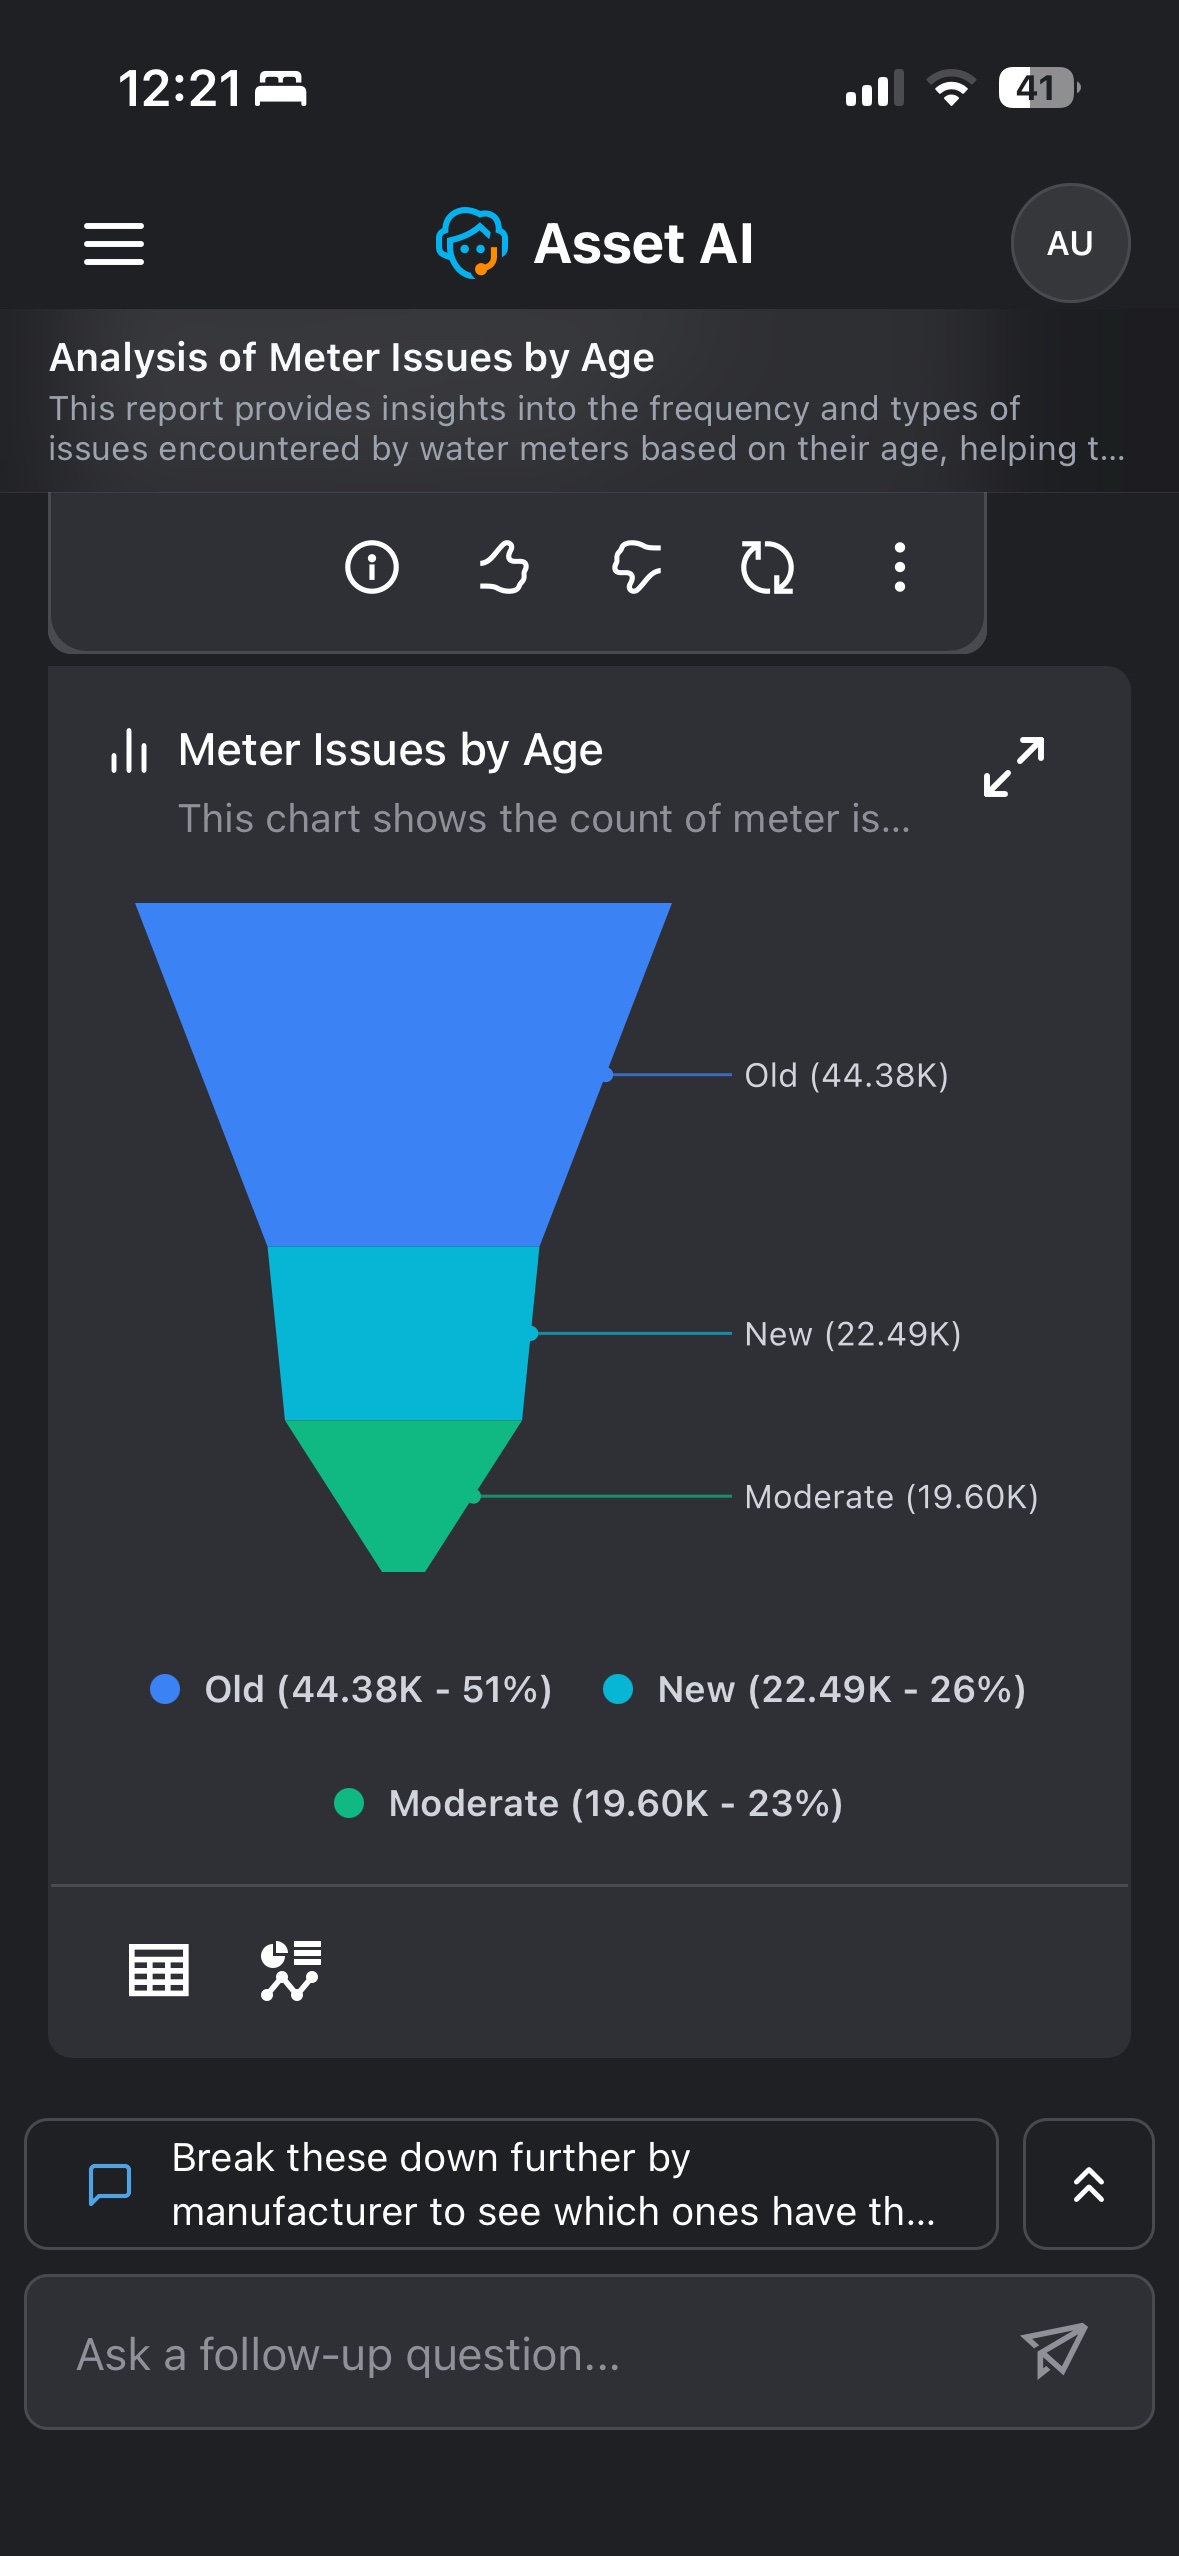
The Funnel chart is displayed when the response ranks category values from largest to smallest. Each category is shown as a horizontal segment, narrowing from the largest at the top to the smallest at the bottom, making it easy to compare their relative scale.
Example: Asking about meter issues broken down by age returns a funnel chart with Old (44.38K) at the top, narrowing down through New (22.49K) to Moderate (19.60K) at the bottom.
Data Requirements and Question Examples
|
Visualization |
Records |
Categorical Field |
Quantitative Field |
Temporal Field |
Question Examples |
|---|---|---|---|---|---|
|
Funnel Chart |
3 to 5 |
1 |
1 |
|
show length of service sum for each age |
|
6 to 10 |
1 |
1 |
|
show length of service sum for each manufacturer |
Treemap
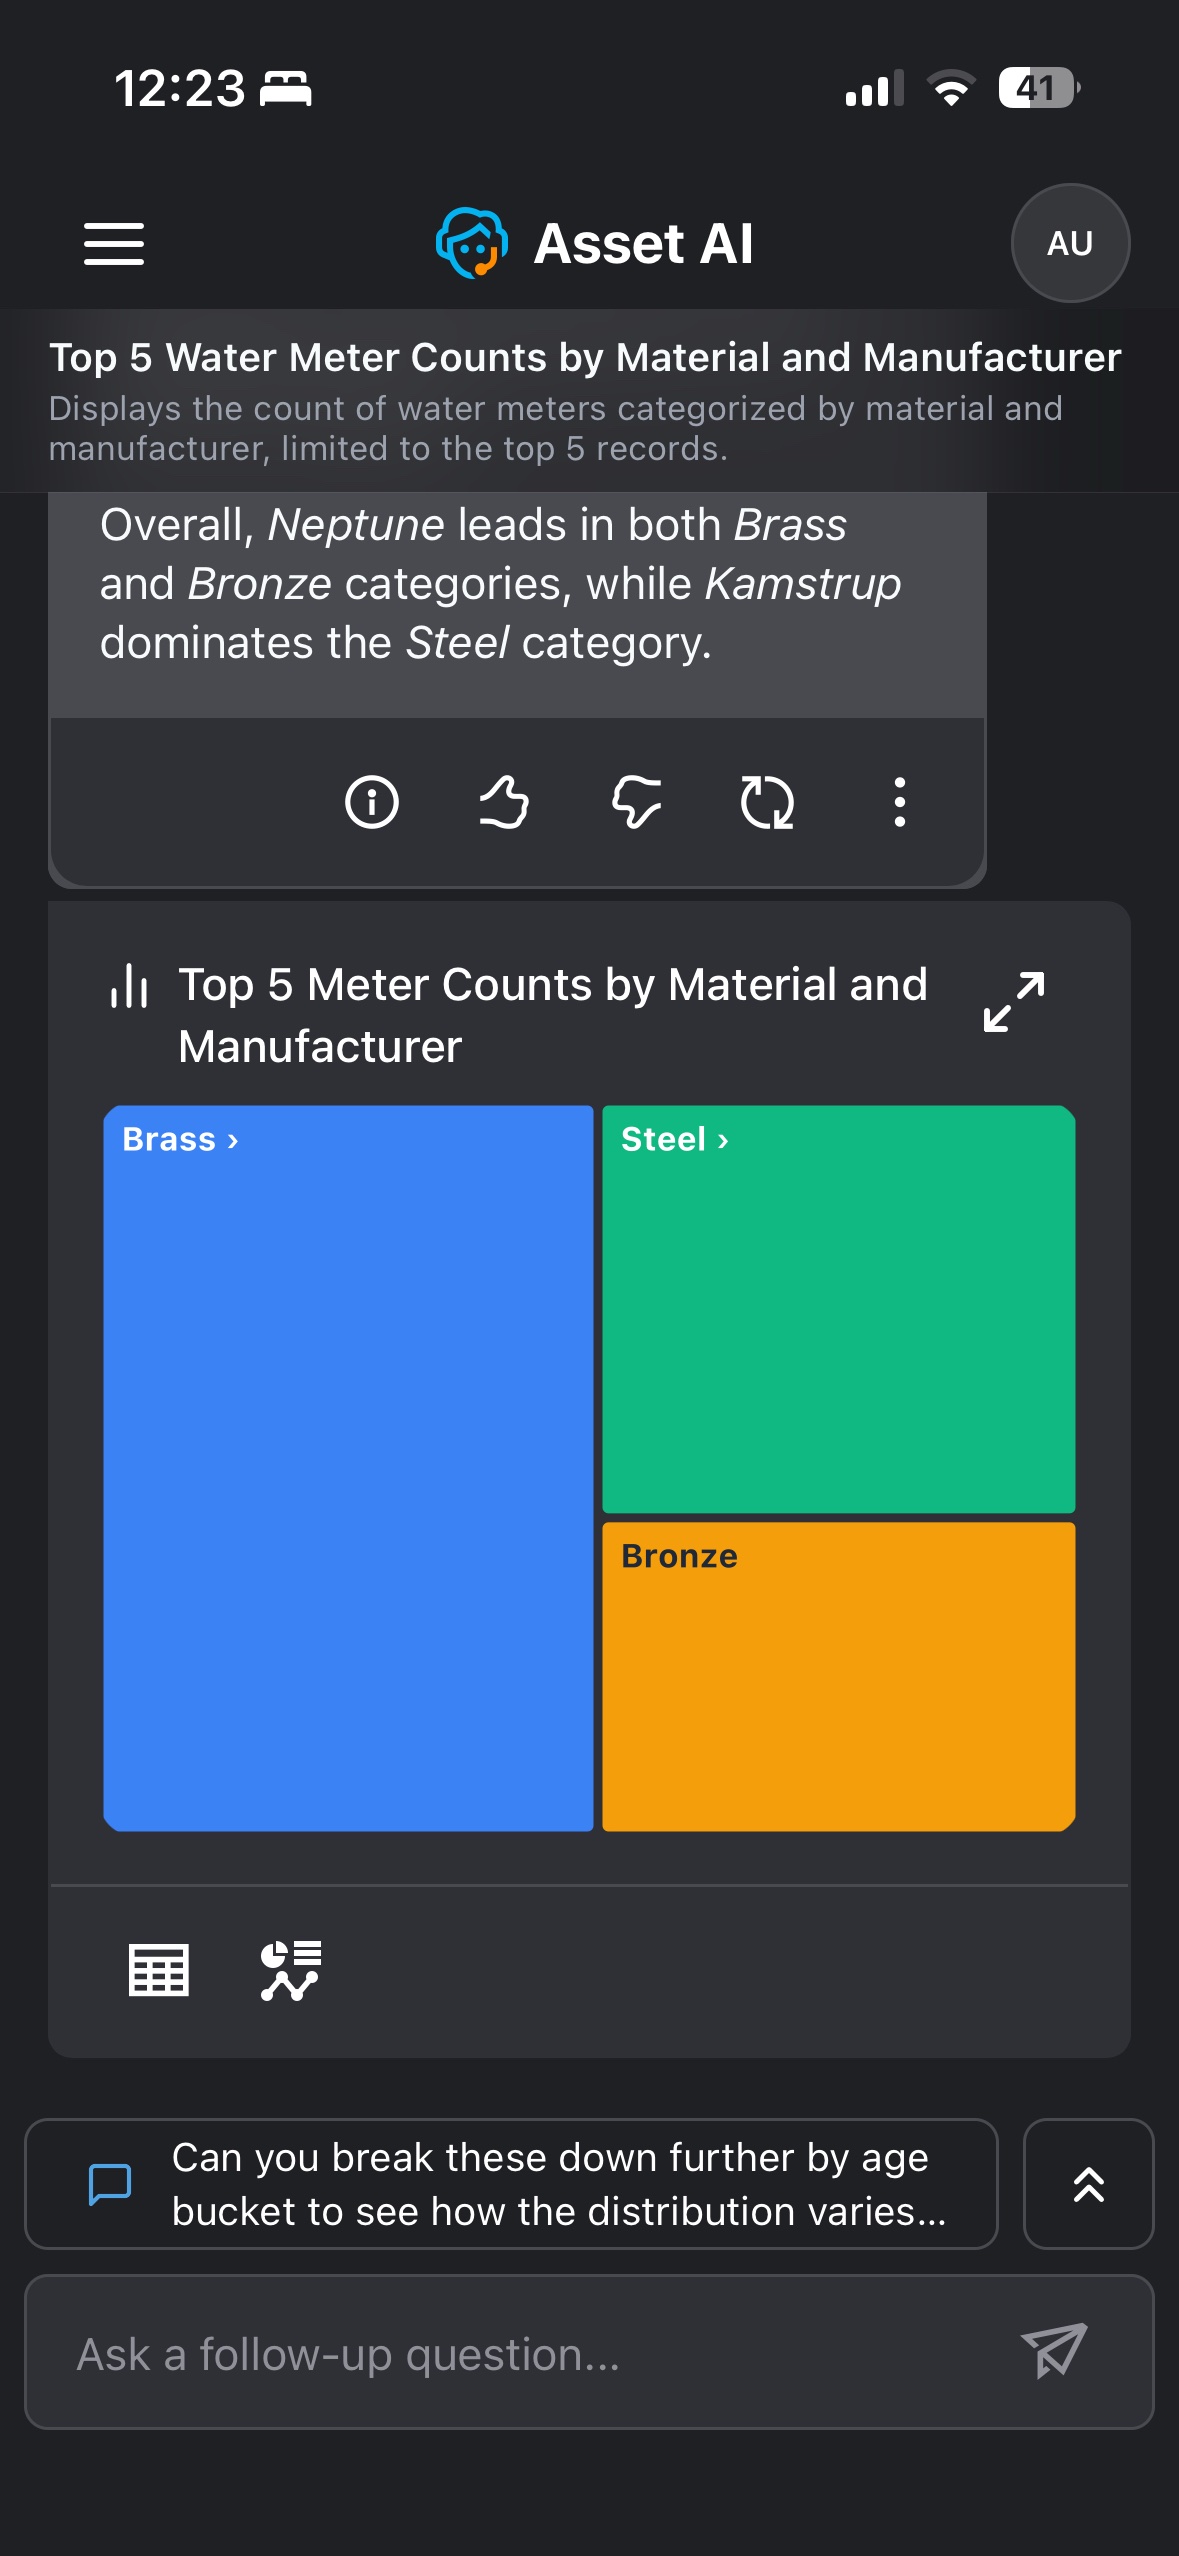
The Treemap chart is displayed when the response involves proportional data across categories, optionally organized into a hierarchy. Each category is shown as a rectangle sized according to its value; where a hierarchy exists, tapping a rectangle drills into its subcategories.
Example: Asking for the top meter counts by material and manufacturer returns a treemap with a rectangle for each material (Brass, Steel, Bronze) sized by count. Tapping into a material breaks it down further by manufacturer — showing, for example, that Neptune leads in Brass and Bronze while Kamstrup leads in Steel.
Data Requirements and Question Examples
|
Visualization |
Records |
Categorical Field |
Quantitative Field |
Temporal Field |
Question Examples |
|---|---|---|---|---|---|
|
Treemap |
|
|
|
|
Show count of length of service for each material and manufacturer. |
Sankey
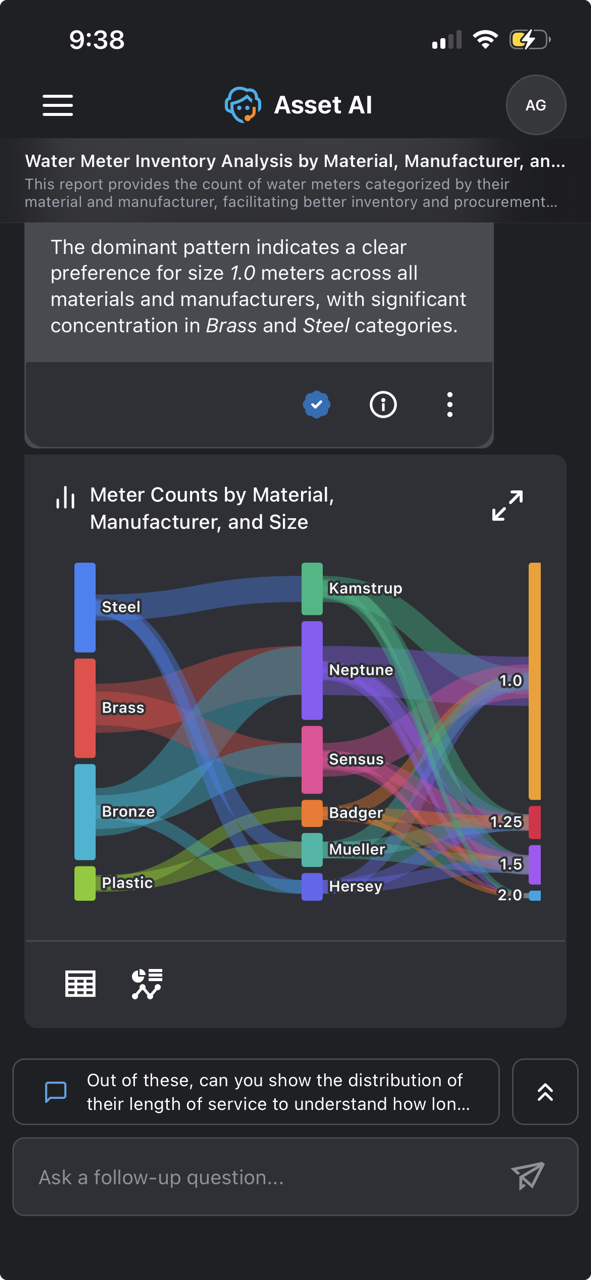
The Sankey chart is displayed when the response involves how a value flows between categories across multiple stages. Each stage's categories are shown as nodes, and the width of the connecting bands shows the volume flowing between them, making it easy to trace how meters split and move from one stage to the next.
Example: Asking about meter counts by material, manufacturer, and size returns a Sankey chart flowing from Material (Steel, Brass, Bronze, Plastic) to Manufacturer (Kamstrup, Neptune, Sensus, and others) to Size (1.0, 1.25, 1.5, 2.0) — with the width of each band showing how many meters follow that path.
Data Requirements and Question Examples
|
Visualization |
Records |
Categorical Field |
Quantitative Field |
Temporal Field |
Question Examples |
|---|---|---|---|---|---|
|
Sankey Chart |
3 to 5 |
2 |
1 |
|
Show count of meters for each material and manufacturer. Limit to 5 records |
|
6 to 10 |
2 |
1 |
|
Show count of meters for each material and manufacturer |
|
|
11 to 25 |
2 |
1 |
|
Show count of meters for each material and issue category. Limit to 25 records |
Heatmap
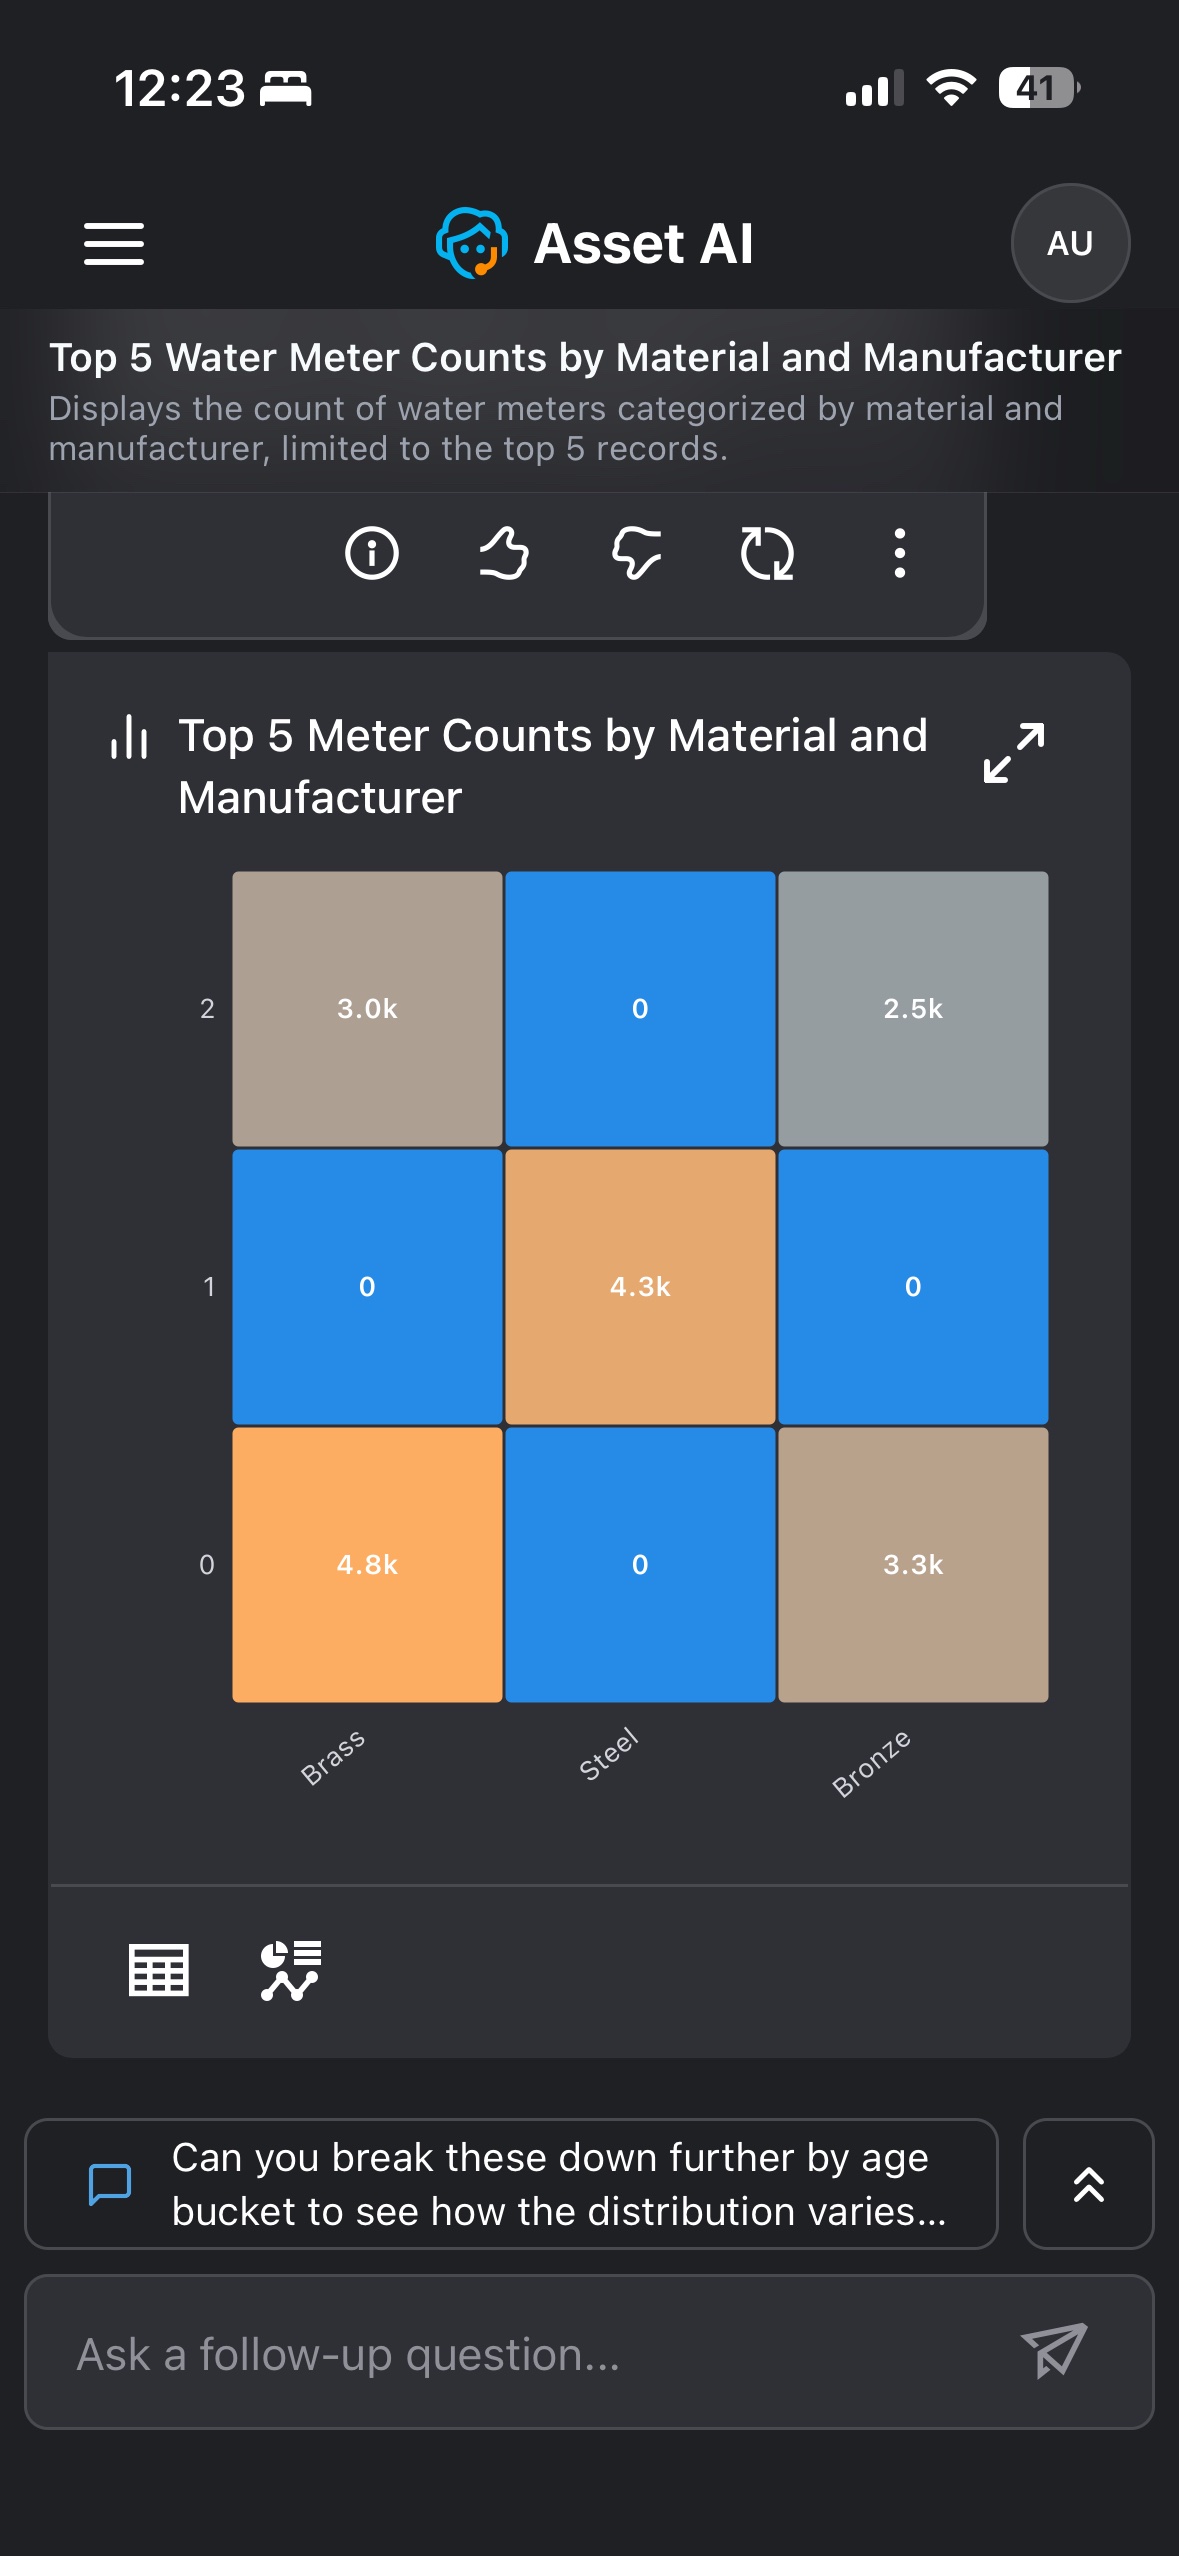
The Heatmap chart is displayed when the response involves values across two categorical dimensions. Each cell's color and shading represent the magnitude of that value, making it easy to spot the highest and lowest combinations at a glance.
Example: Asking for the top meter counts by material and manufacturer returns a heatmap with materials (Brass, Steel, Bronze) on one axis and manufacturer rank on the other, each cell shaded by its meter count — for example, 4.8K for the top Brass manufacturer and 4.3K for the top Steel manufacturer, with 0 shown where no manufacturer exists at that rank.
Data Requirements and Question Examples
|
Visualization |
Records |
Categorical Field |
Quantitative Field |
Temporal Field |
Question Examples |
|---|---|---|---|---|---|
|
Heatmap |
3 to 5 |
2 |
1 |
|
Show count of meters for each material and manufacturer. Limit to 5 records |
|
6 to 10 |
2 |
1 |
|
Show count of meters for each material and manufacturer |
|
|
11 to 25 |
2 |
1 |
|
Show count of meters for each material and issue category. Limit to 25 records |
Boxplot
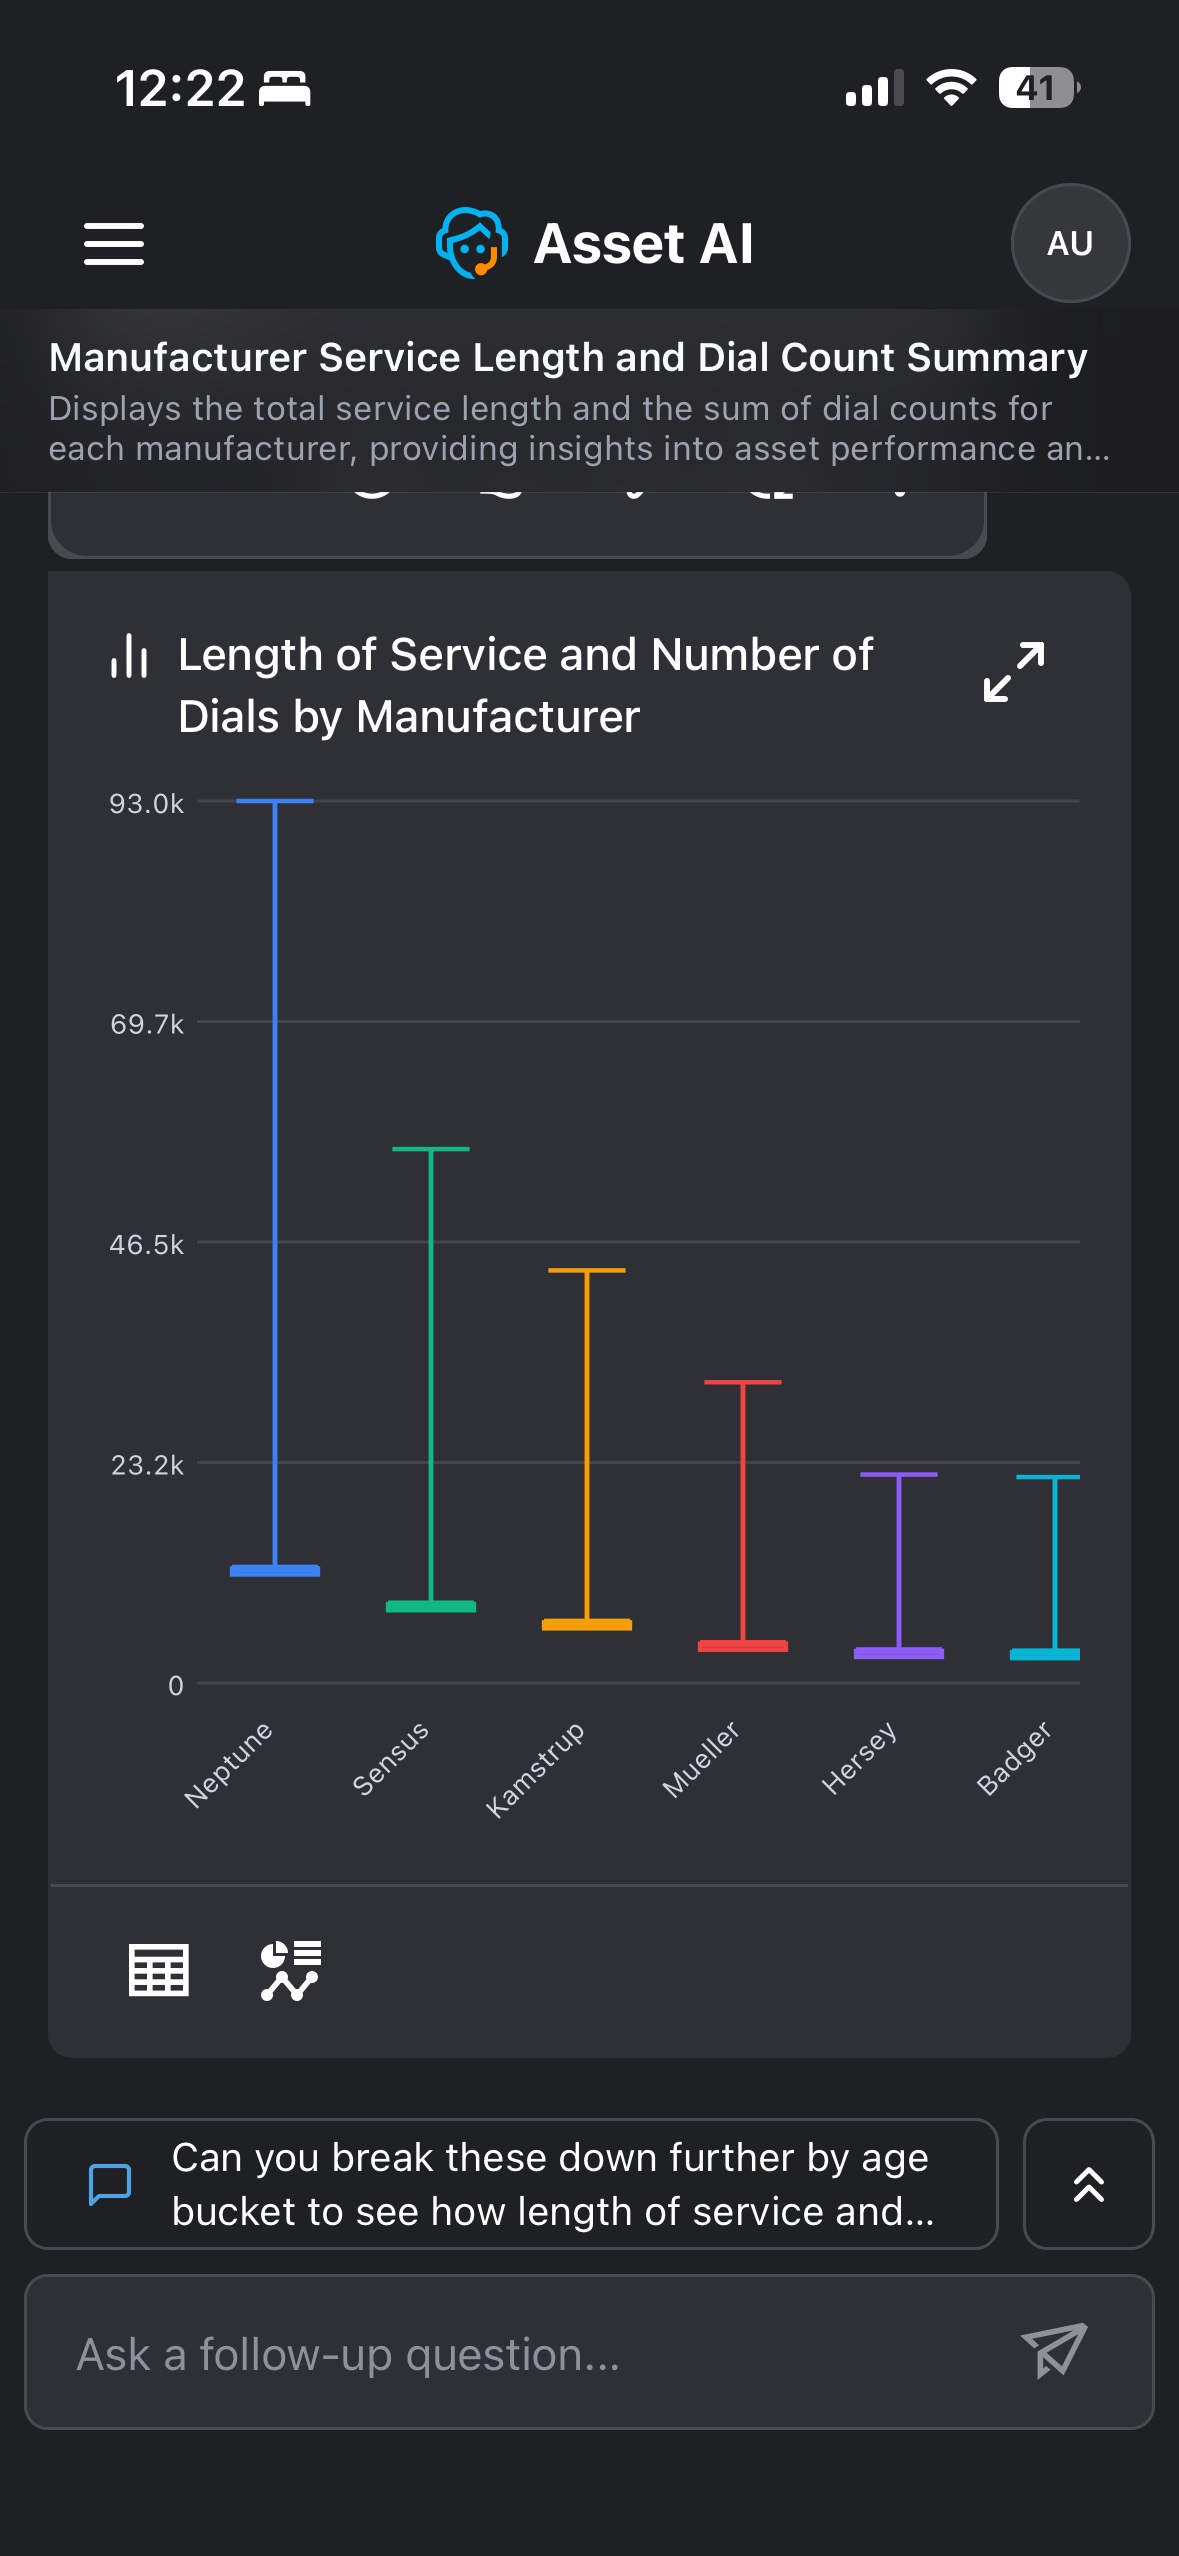
The Boxplot chart is displayed when the response involves the range of a numeric measure across categories. Each category is shown as a vertical line spanning from its minimum to its maximum value, making it easy to compare spread across categories at a glance.
Example: Asking about length of service and dial count by manufacturer returns a boxplot with a line for each manufacturer spanning its minimum to maximum value — for example, Neptune's range extends up to roughly 93K, well above the other manufacturers.
Data Requirements and Question Examples
|
Visualization |
Records |
Categorical Field |
Quantitative Field |
Temporal Field |
Question Examples |
|---|---|---|---|---|---|
|
Boxplot |
6 to 10 |
1 |
1 |
|
Show top 6 count of meter issues for each manufacturer |
|
1 |
2 |
|
Show count of meters and meter issues for each manufacturer |
||
|
1 |
3 |
|
Show count of meters, meter issues and bills for each manufacturer |
||
|
11 to 25 |
1 |
1 |
|
Show count of meter issues for each issue category |
|
|
1 |
2 |
|
Show count of meters and meter issues for each issue category |
||
|
1 |
3 |
|
Show count of meters, meter issues and bills for each issue category |
Word Cloud
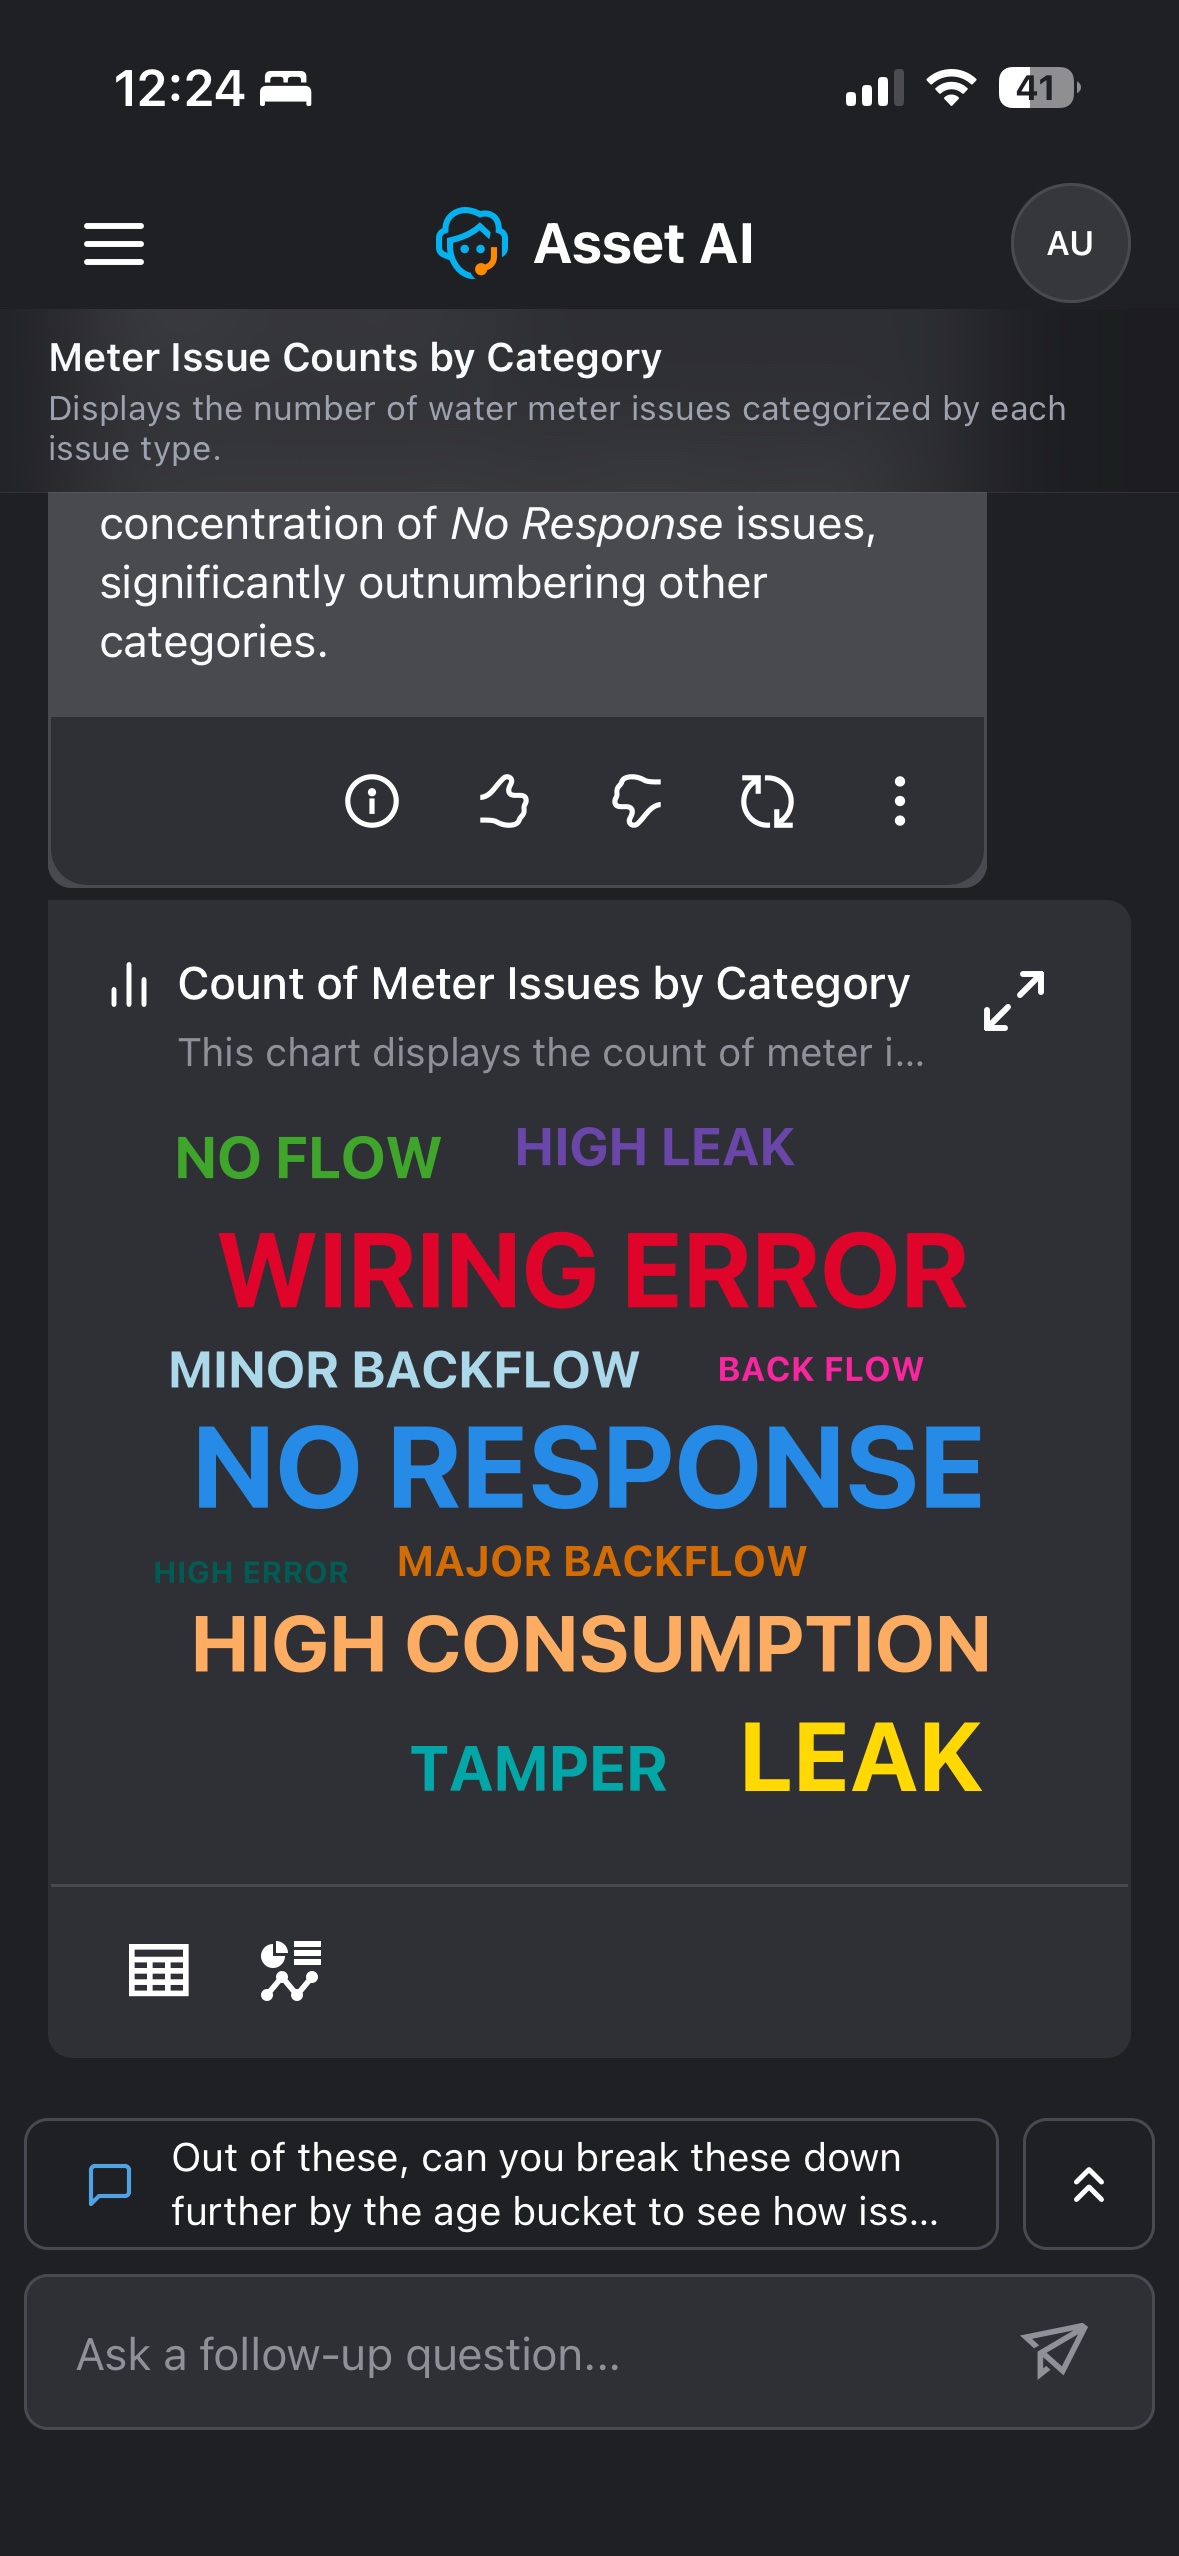
The Word Cloud chart is displayed when the response involves the frequency of categories or terms. Each one is shown as a word sized according to its count — the more frequent, the larger the word — making the dominant categories immediately visible.
Example: Asking about meter issues by category returns a word cloud with each issue type (No Response, Wiring Error, High Consumption, Leak, and others) shown as a word sized by its count. No Response appears largest, reflecting that it significantly outnumbers the other issue categories.
Data Requirements and Question Examples
|
Visualization |
Records |
Categorical Field |
Quantitative Field |
Temporal Field |
Question Examples |
|---|---|---|---|---|---|
|
Word Cloud |
11 to 25 |
1 |
1 |
|
Show count of meter issues by issue category |
|
26 to 100 |
1 |
1 |
|
Show count of meter issues by batch. Limit to 100 records |
Contact App Orchid | Disclaimer